Survey

The Survey pattern uses a data model and a DAX expression to analyze correlation between different transactions related to the same entity, such as a customer’s answers to survey questions.
Basic Pattern Example
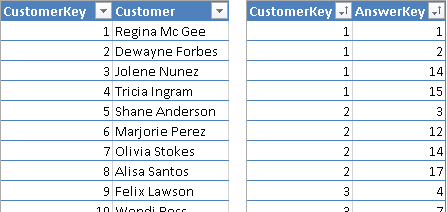
Suppose you have an Answers table containing the answers provided to a survey by customers defined in a Customers table. In the Answers table, every row contains an answer to a question. The first rows of the two tables are shown in Figure 1.
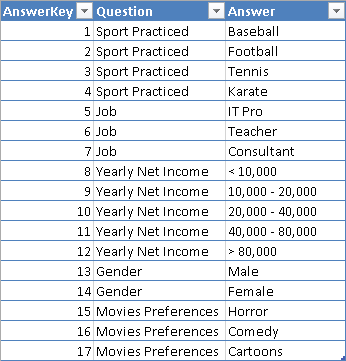
The Questions table in Figure 2 contains all the questions and possible answers, providing a unique key for each row. You can have questions with multiple-choice answers.
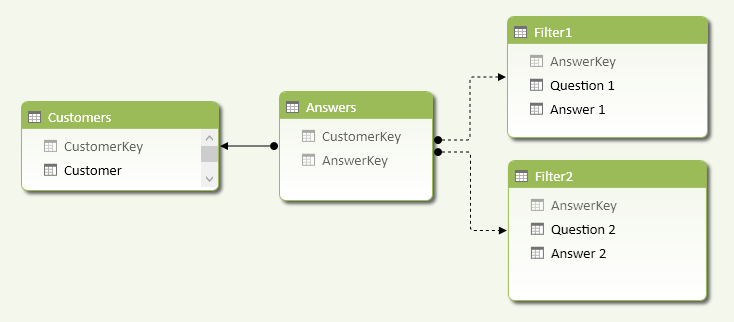
You import the Questions table twice, naming it Filter1 and Filter2. You rename the columns Question and Answer with a suffix identifying the filter they belong to. Every Filter table will become a possible slicer or filter in the pivot table used to query the survey data model. As you see in Figure 3, the relationships between the Answers table and Filter1 and Filter2 are inactive.
You need two filter tables to define a logical AND condition between two questions. For example, to count how many customers have a job as a teacher and play tennis, you need to apply a calculation such as the one described in the CustomersQ1andQ2 measure below.
[CustomersQ1andQ2] :=
CALCULATE (
    COUNTROWS ( Customers ),
    CALCULATETABLE (
        Answers,
        USERELATIONSHIP ( Answers[AnswerKey], Filter2[AnswerKey] )
    ),
    CALCULATETABLE (
        Answers,
        USERELATIONSHIP ( Answers[AnswerKey], Filter1[AnswerKey] )
    )
)
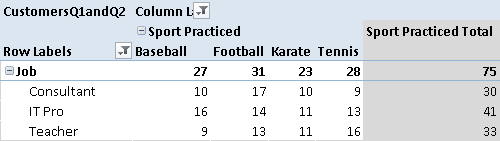
Once you have this measure, you can use a pivot table to put answers from one question in rows, and put answers from another question in columns. The table in Figure 4 has sports in columns and jobs in rows, and you can see there are 16 customers who are tennis-playing teachers. The last column (Sport Practiced Total) shows how many customers practice at least one sport. For example, 33 teachers practice at least one sport.
If you want to compute the answers to just one question, you cannot use CustomersQ1andQ2, because it requires a selection from two different filters. Instead, use the CustomersQ1 measure, which computes the number of customers that answered the question selected in Filter1, regardless of what is selected in Filter2.
[CustomersQ1] :=
=
CALCULATE (
    COUNTROWS ( Customers ),
    CALCULATETABLE (
        Answers,
        USERELATIONSHIP ( Answers[AnswerKey], Filter1[AnswerKey] )
    )
)
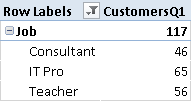
In the DAX expression for CustomersQ1, you have to include the USERELATIONSHIP statement because the relationship with the Filter1 table in the data model is inactive, which is a required condition to perform the calculation defined in CustomersQ1andQ2. Figure 5 shows that there are 56 teachers, and you have seen in Figure 4 that only 33 of them practice at least one sport.
Use Cases
You can use the Survey pattern when you want to analyze correlations between events happening to the same entity. The following is a list of some interesting use cases.
Answers to a Survey
A survey form usually has a set of questions with a predefined list of possible answers. You can have both single-choice and multiple-choice questions. You want to analyze correlations between different questions in the same survey, using a single data model that does not change depending on the structure of the survey. The data in the tables define the survey structure so you do not need to create a different structure for every survey.
Basket Analysis
You can analyze the products bought together in the same transaction, although the Survey pattern can only identify existing relationships. A more specific Basket Analysis pattern is available to detect products that the same customer buys in different transactions.
Evaluation of an Anamnesis (Medical History) Questionnaire
You can structure many questions of an anamnesis questionnaire in a data model that corresponds to the Survey pattern. You can easily analyze the distribution of answers in a set of questionnaires by using a pivot table, with a data model that does not change when new questions are added to the questionnaire. The Survey pattern also handles multiple-choice answers without requiring a column for each answer (which is a common pattern used to adapt this type of data for analysis with Excel).
Complete Pattern
Create a data model like the one shown in Figure 3. You might replace the Customers table with one that represents an entity collecting answers (e.g., a Form table). It is important to use inactive relationships between the Answers and Filters tables.
You can calculate the answers to a single question, regardless of selections made on other filter tables, with the following measures:
CustomersQ1 :=
IF (
    HASONEVALUE ( Filter1[Question 1] ),
    CALCULATE (
        COUNTROWS ( Customers ),
        CALCULATETABLE (
            Answers,
            USERELATIONSHIP ( Answers[AnswerKey], Filter1[AnswerKey] )
        )
    )
)
CustomersQ2 :=
IF (
    HASONEVALUE ( Filter2[Question 2] ),
    CALCULATE (
        COUNTROWS ( Customers ),
        CALCULATETABLE (
            Answers,
            USERELATIONSHIP ( Answers[AnswerKey], Filter2[AnswerKey] )
        )
    )
)
The HASONEVALUE function checks whether the user selected only one question. If more than one question is selected in a filter table, the interpretation could be ambiguous: should you consider an AND or an OR condition between the two questions? The IF statement returns BLANK when multiple questions are selected within the same filter table.
Selecting multiple answers, however, is possible and it is always interpreted as an OR condition. For example, if the user selects both Baseball and Football answers for the Sport Practiced question, it means she wants to know how many customers practice baseball, or football, or both. This is the reason why the CALCULATE statement evaluates the number of rows in the Customers table, instead of counting the number of rows in the Answers table.
In case the user uses two filter tables, one question is possible for each filter. The answers to each question are considered in an OR condition, but the two questions are considered in an AND condition. For example, if the user selects Consultant and Teacher answers for the Job question in Filter1, and she selects Baseball and Football for the Sport Practiced question in Filter2, it means she wants to know how many customers who are consultants or teachers also practice baseball, or football, or both. You implement such a calculation with the following measure:
CustomersQ1andQ2 :=
SWITCH (
    TRUE,
    NOT ( ISCROSSFILTERED ( Filter2[AnswerKey] ) ), [CustomersQ1],
    NOT ( ISCROSSFILTERED ( Filter1[AnswerKey] ) ), [CustomersQ2],
    IF (
        HASONEVALUE ( Filter1[Question 1] )
            && HASONEVALUE ( Filter2[Question 2] ),
        IF (
            VALUES ( Filter2[Question 2] )
                <> VALUES ( Filter1[Question 1] ),
            CALCULATE (
                COUNTROWS ( Customers ),
                CALCULATETABLE (
                    Answers,
                    USERELATIONSHIP ( Answers[AnswerKey], Filter2[AnswerKey] )
                ),
                CALCULATETABLE (
                    Answers,
                    USERELATIONSHIP ( Answers[AnswerKey], Filter1[AnswerKey] )
                )
            )
        )
    )
)
There are a few more checks in this formula in order to handle special conditions. If there are no filters active on the Filter2 table, then you can use the calculation for a single question, using the CustomersQ1 measure. In a similar way, if there are no filters active on the Filter1 table, you can use the CustomersQ2 measure. The ISCROSSFILTERED function just checks a column of the filter table to do that.
If a filter is active on both the Filter1 and Filter2 tables, then you want to calculate the number of customers satisfying the filters only if the user selected a single but different question in both Filter1 and Filter2; otherwise, you return a BLANK. For example, even if there are no filters on questions and answers in the pivot table rows in Figure 6, there are no duplicated rows with the answers to the Gender question, because we do not want to show an intersection between the same questions.
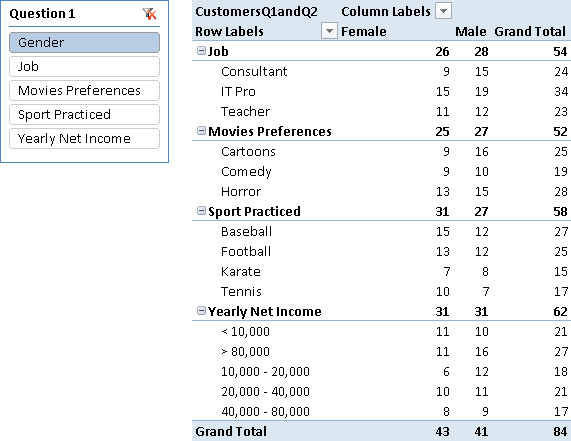
When you look at the result for a question without selecting an answer, the number you see is the number of unique customers who gave at least one answer to that question. However, it is important to consider that the data model always supports multiple-choice questions, even when the nature of the question is single-choice. For example, the Gender question is a single-choice one and the sum of Male and Female answers should correspond to the number of unique customers who answered the Gender question. However, you might have conflicting answers to the Gender question for the same customer. The data model does not provide any constraint that prevents such a conflict: you have to check data quality before importing data.
Important
Using a drillthrough action on measures used in the Survey pattern will produce unexpected results. The drillthrough only returns data filtered by active relationships in the data model, ignoring any further calculation or filter made through DAX expressions. If you want to obtain the list of customers that gave a particular combination of answers, you have to put the customer name in the pivot table rows and use slicers of pivot table filters to select the desired combination of questions and answers.
Slicer Differences in Excel 2010 and Excel 2013
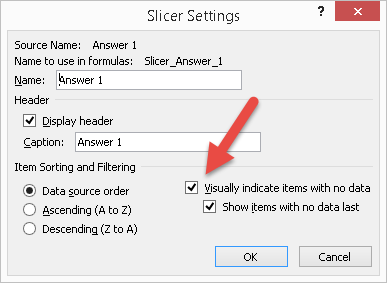
When you use slicers to display a selection of questions and answers, remember that there is slightly different behavior between Excel 2010 and Excel 2013. If you have a slicer with questions and another with answers for the same filter, you would like the slicer for the answers to display only the possible choices for the selected question. In Excel 2010, you can only change the position of the answers, so that possible choices for the selected question are displayed first in the slicer: to do that, set the Show Items With No Data Last checkbox (in the Slicer Settings dialog box shown in Figure 7).
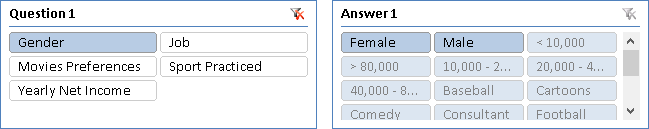
Using this setting, the Female and Male answers for the selected Gender question are displayed first in the Answer1 slicer, as you see in Figure 8.
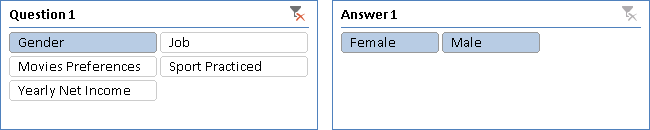
With Excel 2013, you can hide the answers belonging to questions that are not selected, by setting the Hide Items With No Data checkbox shown in Figure 9.
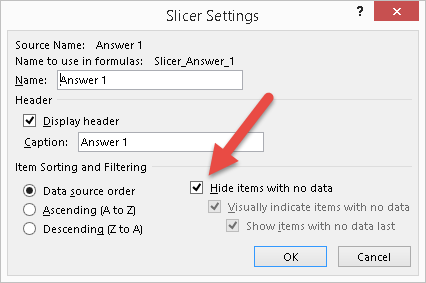
In this way, the Answer1 slicer does not display answers unrelated to the selection made in the Question1 slicer, as you see in Figure 10.
Checks whether all arguments are TRUE, and returns TRUE if all arguments are TRUE.
AND ( <Logical1>, <Logical2> )
Specifies an existing relationship to be used in the evaluation of a DAX expression. The relationship is defined by naming, as arguments, the two columns that serve as endpoints.
USERELATIONSHIP ( <ColumnName1>, <ColumnName2> )
Returns true when there’s only one value in the specified column.
HASONEVALUE ( <ColumnName> )
Returns TRUE if any of the arguments are TRUE, and returns FALSE if all arguments are FALSE.
OR ( <Logical1>, <Logical2> )
Checks whether a condition is met, and returns one value if TRUE, and another value if FALSE.
IF ( <LogicalTest>, <ResultIfTrue> [, <ResultIfFalse>] )
Returns a blank.
BLANK ( )
Evaluates an expression in a context modified by filters.
CALCULATE ( <Expression> [, <Filter> [, <Filter> [, … ] ] ] )
Returns true when the specified table or column is crossfiltered.
ISCROSSFILTERED ( <TableNameOrColumnName> )
This pattern is designed for Excel 2010-2013. An alternative version for Power BI / Excel 2016-2019 is also available.
This pattern is included in the book DAX Patterns 2015.


Downloads
Download the sample files for Excel 2010-2013: