Survey

The Survey pattern uses a data model to analyze correlations between different events related to the same entity, such as customer answers to survey questions. For example, in healthcare organizations the Survey pattern can be used to analyze data about patient status, diagnoses, and medicine prescribed.
Pattern description
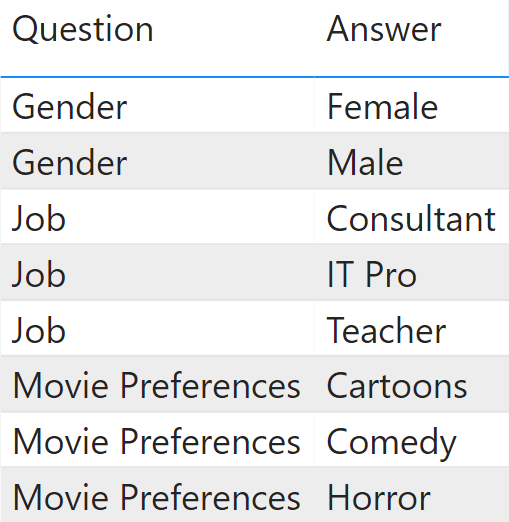
You have a model that stores answers to questions. Therefore, consider a Questions table containing questions and possible answers shown in Figure 1.
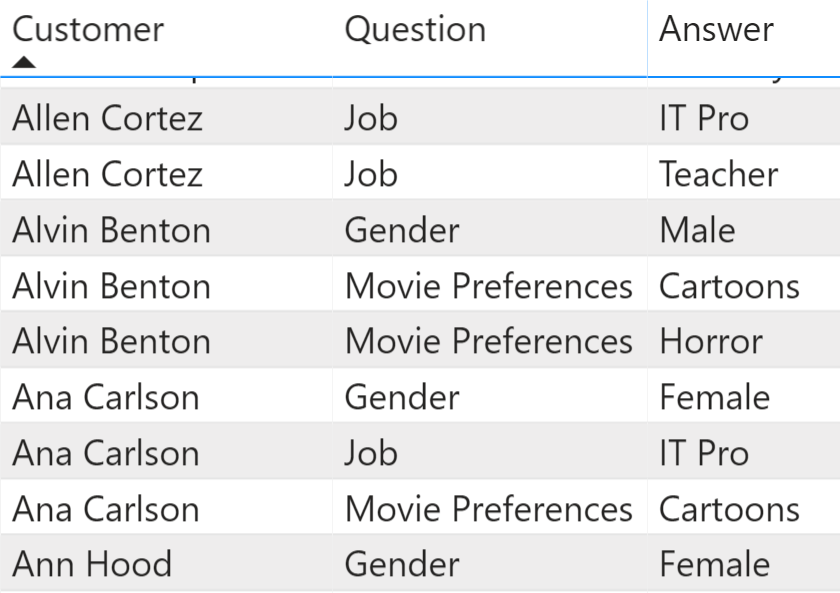
The answers are stored in an Answers table containing in each row the survey target (the Customer in this case), one question and one answer. There are multiple rows in case the same customer provides multiple answers to the same question. The real model would store information with integer keys; In Figure 2 we are using strings to clarify the concept.
By using a DAX formula, we can answer a request like, “How many customers enjoy cartoons, broken down by job and gender?” Consider Figure 3 as an example. In this table, totals are not strict totals. This is explained later.
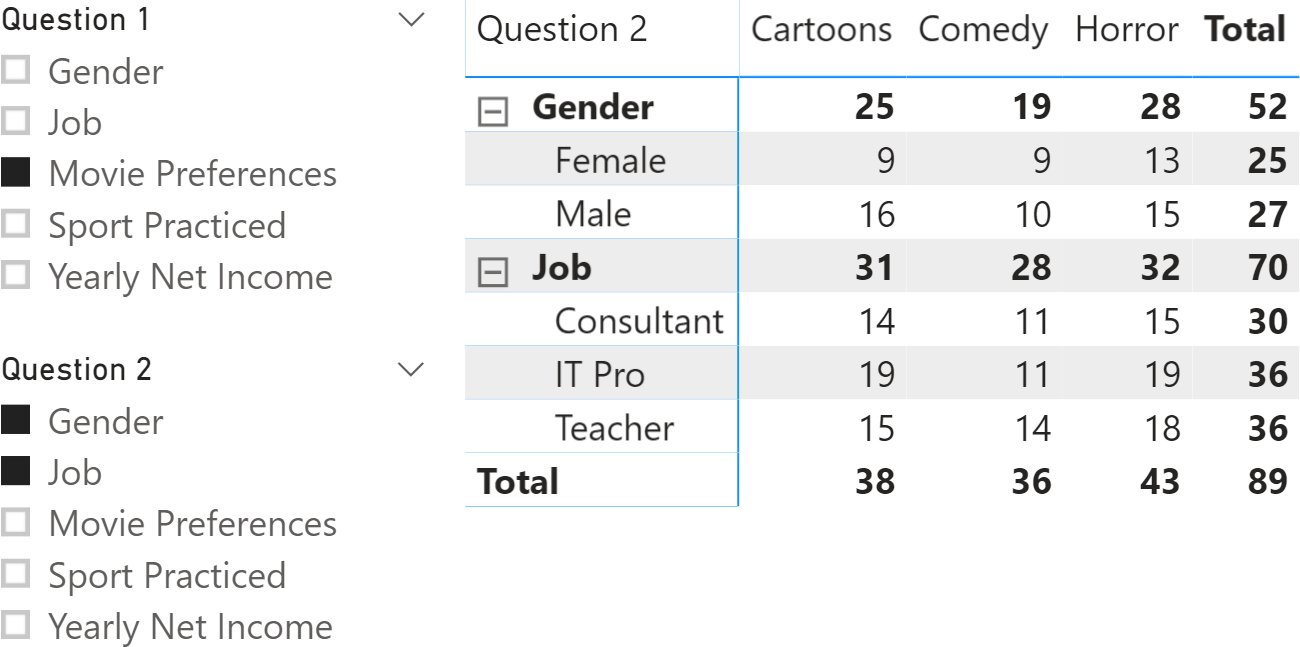
The report includes two slicers to select the questions to intersect in the report. The columns in the matrix have the answers to the question selected in the Question 1 slicer, whereas the rows of the matrix provide the details of questions and answers corresponding to the selection made in the Question 2 slicer. The highlighted cell shows that 9 customers who answered Cartoons to the Movie Preferences question also answered Female to the Gender question.
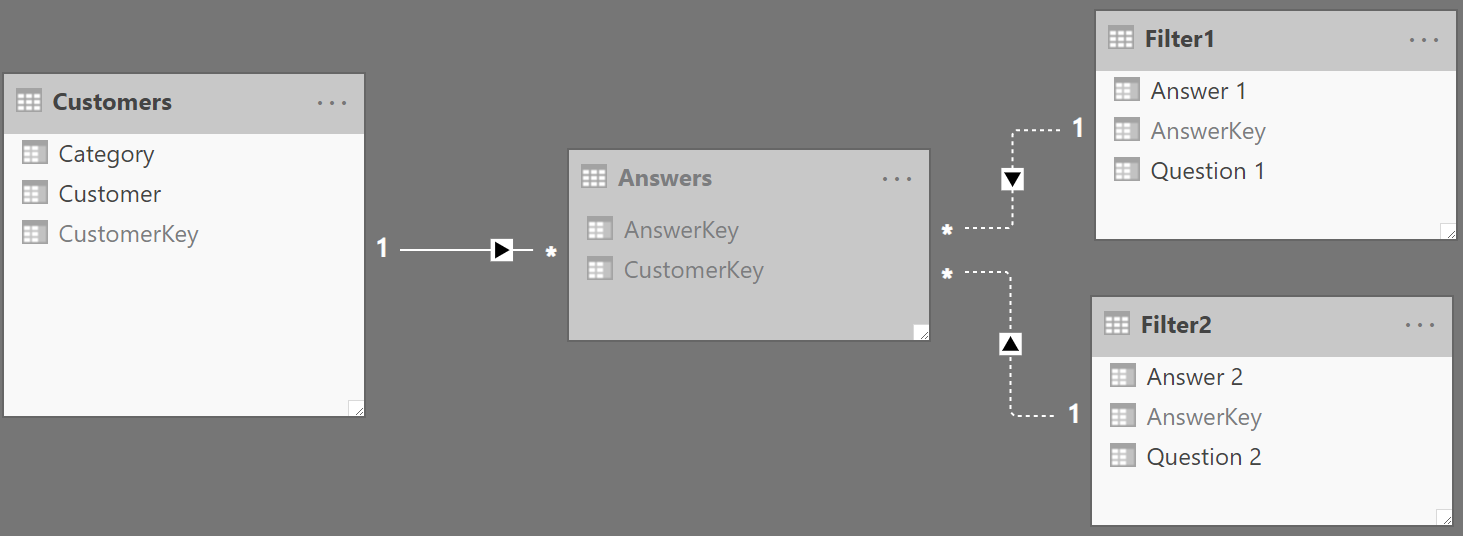
In order to implement this pattern, you need to load the Questions table twice. This way you can use two slicers for the questions to analyze. Moreover, the relationship between the two copies of the questions must be inactive. Because we use the tables as filters, we named them Filter1 and Filter2. You can see the resulting diagram in Figure 4.
To compute the number of customers who answered Q1 (the question filtered by Filter1) and Q2 (the question filtered by Filter2) you can use the following formula:
CustomersQ1andQ2 :=
VAR CustomersQ1 =
    CALCULATETABLE (
        VALUES ( Answers[CustomerKey] ),
        USERELATIONSHIP ( Answers[AnswerKey], Filter1[AnswerKey] )
    )
VAR CustomersQ2 =
    CALCULATETABLE (
        VALUES ( Answers[CustomerKey] ),
        USERELATIONSHIP ( Answers[AnswerKey], Filter2[AnswerKey] )
    )
RETURN
    CALCULATE (
        COUNTROWS ( Customers ),
        CROSSFILTER ( Answers[CustomerKey], Customers[CustomerKey], BOTH ),
        CustomersQ1,
        CustomersQ2
    )
The formula activates the correct relationship when computing CustomersQ1 and CustomersQ2. It then uses the two variables as filters for the Answers table, which filters the customers through the CROSSFILTER modifier.
You can compute any calculation using the previous formula – provided that the CROSSFILTER modifier makes the Answers table filter the table you are basing your code on. Therefore, you can replace COUNTROWS ( Customer ) with any expression involving the Customers table. For example, the RevenueQ1andQ2 measure provides the total revenue made off of the customers included in the selection; The only difference with the CustomersQ1andQ2 measure is the Revenue Amount measure reference that replaces the previous COUNTROWS ( Customer ) expression:
RevenueQ1andQ2 :=
VAR CustomersQ1 =
    CALCULATETABLE (
        VALUES ( Answers[CustomerKey] ),
        USERELATIONSHIP ( Answers[AnswerKey], Filter1[AnswerKey] )
    )
VAR CustomersQ2 =
    CALCULATETABLE (
        VALUES ( Answers[CustomerKey] ),
        USERELATIONSHIP ( Answers[AnswerKey], Filter2[AnswerKey] )
    )
RETURN
    CALCULATE (
        [Revenue Amount],
        CROSSFILTER ( Answers[CustomerKey], Customers[CustomerKey], BOTH ),
        CustomersQ1,
        CustomersQ2
    )
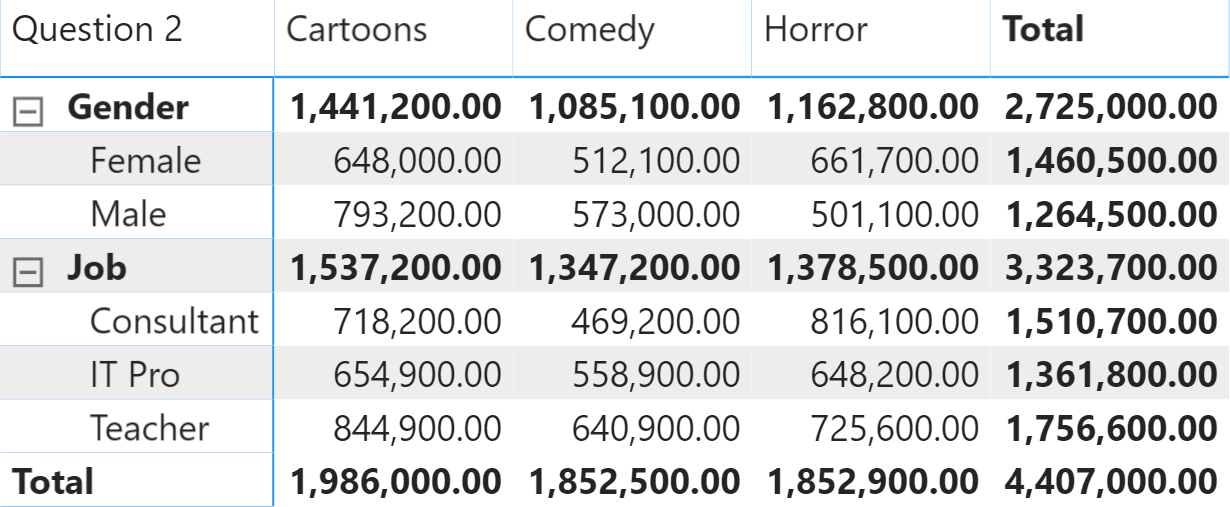
The result of the RevenueQ1andQ2 measure is visible in Figure 5.
If you only count the number of customers, then the previous code can be simplified and sped up by using the following variation:
CustomersQ1andQ2optimized :=
VAR CustomersQ1 =
    CALCULATETABLE (
        VALUES ( Answers[CustomerKey] ),
        USERELATIONSHIP ( Answers[AnswerKey], Filter1[AnswerKey] )
    )
VAR CustomersQ2 =
    CALCULATETABLE (
        VALUES ( Answers[CustomerKey] ),
        USERELATIONSHIP ( Answers[AnswerKey], Filter2[AnswerKey] )
    )
RETURN
    CALCULATE (
        DISTINCTCOUNT ( Answers[CustomerKey] ),
        CustomersQ1,
        CustomersQ2
    )
It is important to understand the condition computed in each cell. We use Figure 6 to explain this further, where we labeled a few cells from A to E.
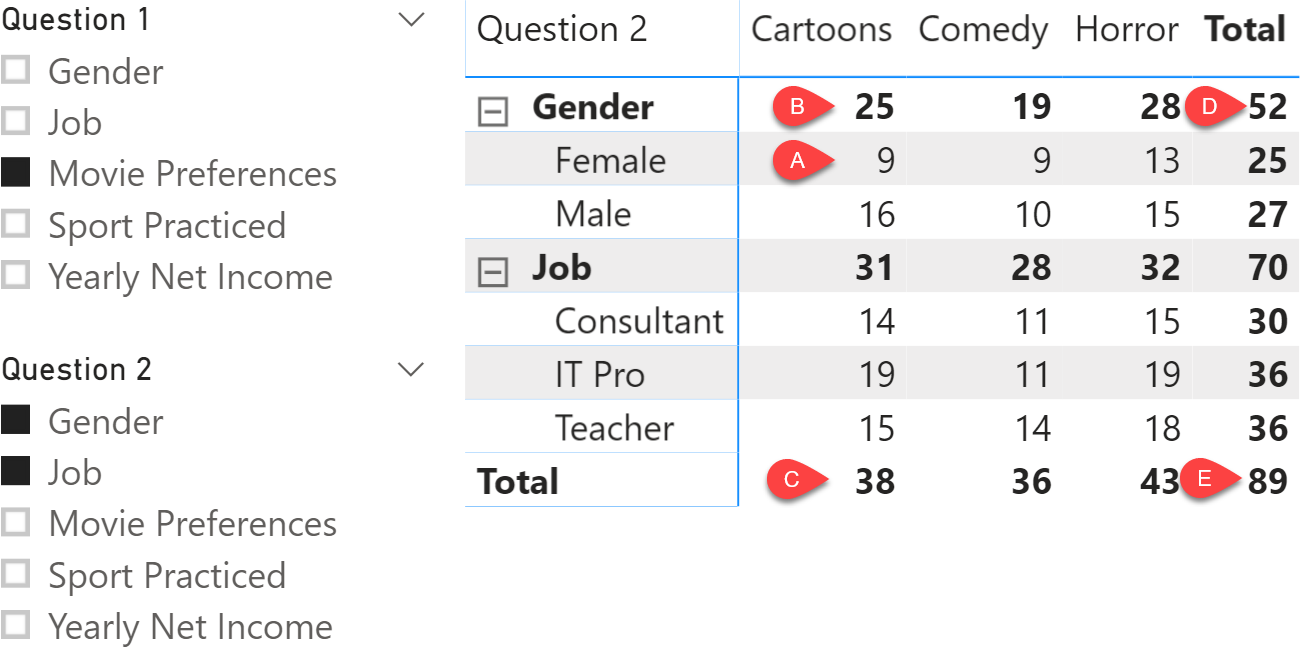
Here is what is computed in each cell:
| A | Female and prefers Cartoons |
| B | ( Female or Male ) and prefers Cartoons |
| C | ( Female or Male or Consultant or IT Pro or Teacher ) and prefers Cartoons |
| D | ( Female or Male ) and prefers ( Cartoons or Comedy or Horror ) |
| E | ( Female or Male or Consultant or IT Pro or Teacher ) and prefers ( Cartoons or Comedy or Horror ) |
The formula uses an and condition for the intersection between questions selected in Question 1 and Question 2, whereas it uses an or condition for the answers provided to one same question. Remember that the or condition means “any combination” (do not confuse it with an “exclusive or”) and the or condition also implies a non-additive behavior of the measure.
Specifies cross filtering direction to be used in the evaluation of a DAX expression. The relationship is defined by naming, as arguments, the two columns that serve as endpoints.
CROSSFILTER ( <LeftColumnName>, <RightColumnName>, <CrossFilterType> )
Counts the number of rows in a table.
COUNTROWS ( [<Table>] )
This pattern is designed for Power BI / Excel 2016-2019. An alternative version for Excel 2010-2013 is also available.
This pattern is included in the book DAX Patterns, Second Edition.


Video

Do you prefer a video?
This pattern is also available in video format. Take a peek at the preview, then unlock access to the full-length video on SQLBI.com.Watch the full video — 20 min.
Downloads
Download the sample files for Power BI / Excel 2016-2019: