Parent-Child Hierarchies

DAX does not directly support parent-child hierarchies. To obtain a browsable hierarchy in the data model, you have to naturalize a parent-child hierarchy. DAX provides specific functions to naturalize a parent-child hierarchy using calculated columns. The complete pattern also includes measures that improve the visualization of ragged hierarchies in Power Pivot.
Basic Pattern Example
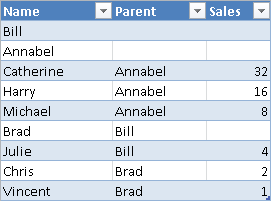
Suppose you have an Agents table containing sales figures for each agent. The Parent column specifies the direct report of each agent, as you see in Figure 1.
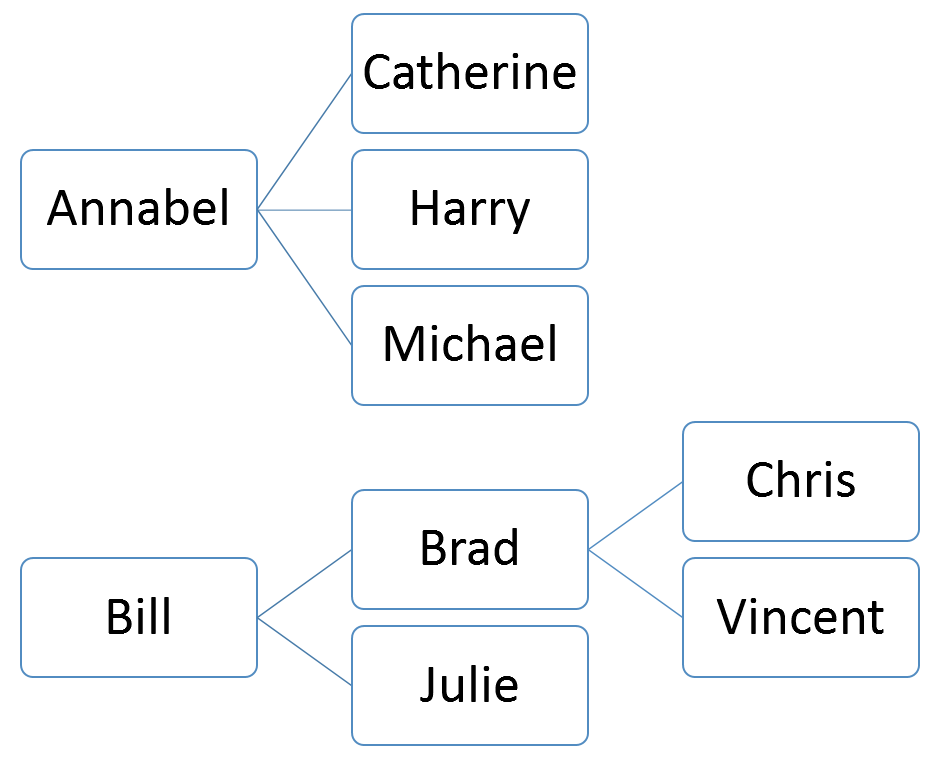
You might represent relationships between nodes using a tree structure, where all nodes without a parent are roots of a hierarchy tree, as shown in Figure 2.
Your goal is to create one calculated column for each level of the hierarchy. To create the right number of calculated columns, you must know in advance the maximum depth of the hierarchy. Otherwise, you have to estimate it, because this number cannot change dynamically. Power Pivot and Analysis Services hierarchies have an intrinsic limit of 64 levels.
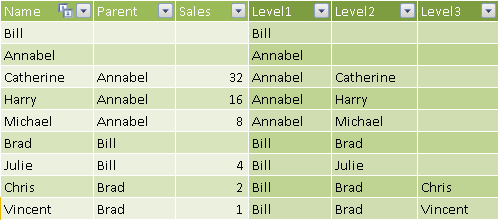
Figure 3 shows the resulting table with the naturalized hierarchy.
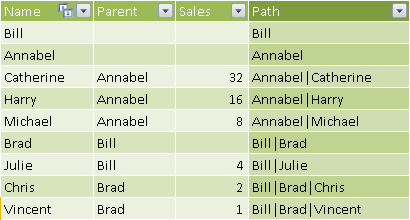
You can create these columns in DAX by leveraging a hidden calculated column that provides a string with the complete path to reach the node in the current row of the table. The Path column in Figure 4 provides this content using the special PATH function.
[Path] = PATH ( Nodes[Name], Nodes[Parent] )
Each column that defines a level in the hierarchy uses the PATHITEM function to retrieve the proper value for that level, as shown in Figure 3.
[Level1] = PATHITEM ( Nodes[Path], 1 )

[Level2] = PATHITEM ( Nodes[Path], 2 )

[Level3] = PATHITEM ( Nodes[Path], 3 )
You define the hierarchy in the diagram view of the data model shown in Figure 5.
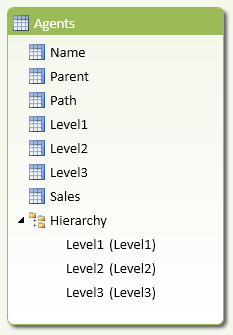
You can navigate the resulting hierarchy in Excel as shown in Figure 6.
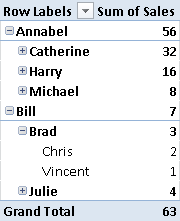
You can browse a pivot table and navigate this hierarchy down to the third level. If an intermediate node of the hierarchy has no children, you can still drill-down to an empty label, although this would result in a row of the pivot table with no description. You can avoid this behavior in Analysis Services Tabular by using the HideMemberIf property, and in Power Pivot by using the technique described in the complete pattern.
Use Cases
You can use the Parent-Child Hierarchies pattern any time you have a corresponding structure in your source data. This is a list of common use cases.
Profit and Loss Account Hierarchy
Most profit and loss statements have a native parent-child hierarchy for representing the list of accounts. When this is not the native representation in the data source, a parent-child hierarchy can be useful to show an alternative custom grouping of original accounts, such as in balance sheet reclassification.
Organizational Structure
Company organizational structures are often represented as parent-child hierarchies. One of the limitations of parent-child hierarchies is that each node must have a single parent. Complex organizations that do not respect this constraint require more complex graphs, and mapping them to a parent-child hierarchy requires a normalization to a regular organization tree.
Complete Pattern
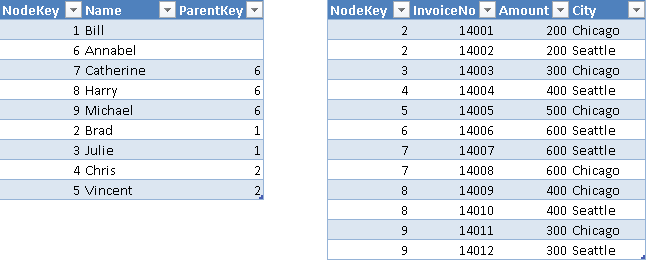
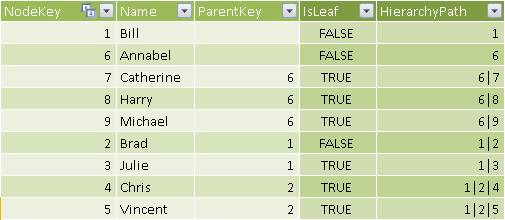
Suppose you have a Nodes table containing one row per node, with a ParentKey column that defines the parent of every node. The Transactions table has a many-to-one relationship with the Nodes table. You can see the two tables in Figure 7.
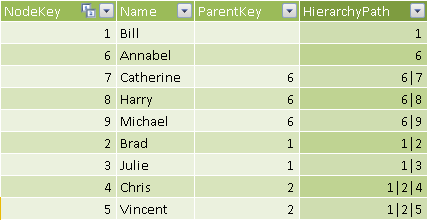
You create a hidden HierarchyPath column containing the result of the PATH function, which provides a string with the complete path to reach the node in the current row of the table, as shown in Figure 8.
[HierarchyPath] = PATH ( Nodes[NodeKey], Nodes[ParentKey] )
You naturalize the hierarchy by creating a hidden column for each level of the hierarchy. You have to define the maximum depth of the hierarchy in advance, planning enough levels for future growth. For each level, you populate the column with the node name of the hierarchy path at that level. You need to duplicate the name of the leaf node if the level is higher than the number of levels in the hierarchy path, which you obtain in the HierarchyDepth column using the PATHLENGTH function.
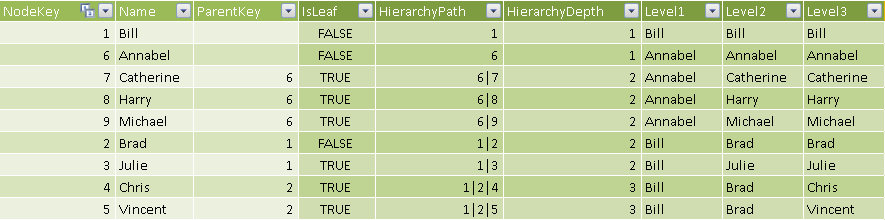
In Figure 9 you can see the resulting column for the levels of the hierarchy, populated using the LOOKUPVALUE and PATHITEM functions. The hierarchy path is a string, but the LOOKUPVALUE has to match an integer column, so you need to cast the hierarchy path value to INT using the third argument of PATHITEM. The following formulas are used for the calculated columns in Figure 9.
[HierarchyDepth] = PATHLENGTH ( Nodes[HierarchyPath] )

[Level1] =
LOOKUPVALUE (
    Nodes[Name],
    Nodes[NodeKey],
    PATHITEM ( Nodes[HierarchyPath], 1, INTEGER )
)

[Level2] =
IF (
    Nodes[HierarchyDepth] >= 2,
    LOOKUPVALUE (
        Nodes[Name],
        Nodes[NodeKey],
        PATHITEM ( Nodes[HierarchyPath], 2, INTEGER )
    ),
    Nodes[Level1]
)

[Level3] =
IF (
    Nodes[HierarchyDepth] >= 3,
    LOOKUPVALUE (
        Nodes[Name],
        Nodes[NodeKey],
        PATHITEM ( Nodes[HierarchyPath], 3, INTEGER )
    ),
    Nodes[Level2]
)
In order to hide nodes duplicated at lower levels while browsing hierarchy in a pivot table, you create an IsLeaf calculated column, which contains a flag for nodes that have no children in the parent-child hierarchy, as you see in Figure 10.
[IsLeaf] =
CALCULATE (
    COUNTROWS ( Nodes ),
    ALL ( Nodes ),
    Nodes[ParentKey] = EARLIER ( Nodes[NodeKey] )
) = 0
The naturalized hierarchy duplicates leaf-level nodes that you do not want to display in a pivot table. In an Analysis Services Tabular model, you can hide these nodes by setting the HideMemberIf property with BIDS Helper. In Power Pivot, you have to build a DAX measure that returns a blank value for a “duplicated” node. You create two hidden measures to support such a calculation: BrowseDepth calculates the level of the hierarchy displayed in a pivot table, and MaxNodeDepth returns the maximum depth of the original parent-child hierarchy starting at the node considered. When BrowseDepth is higher than MaxNodeDepth, the node value should be hidden in the pivot table. You can see in Figure 11 a comparison of the BrowseDepth and MaxNodeDepth values returned for each node of the naturalized hierarchy.
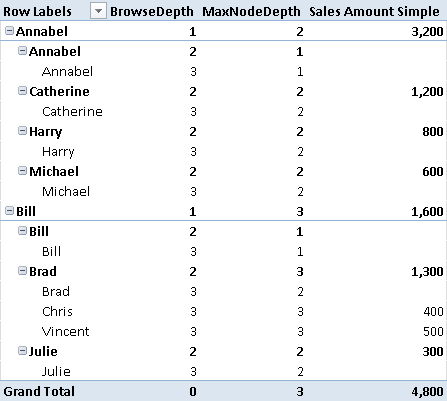
The Sales Amount Simple measure in Figure 11 displays blank when BrowseDepth value is higher than MaxNodeDepth.
[Sales Amount Simple] :=
IF (
    [BrowseDepth] > [MaxNodeDepth],
    BLANK (),
    SUM ( Transactions[Amount] )
)
If you display such a measure in a pivot table with default settings (hiding empty rows), you will see a result like Figure 12.
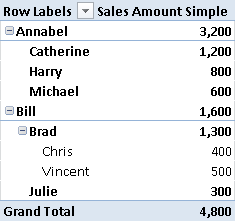
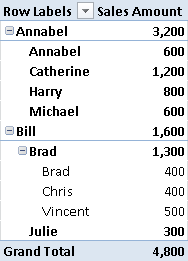
The Sales Amount Simple measure does not display a separate value for intermediate nodes that have values associated both with children and with the node itself. For example, in Figure 12 you can see that the value related to Annabel is higher than the sum of her children, and the same happens for the value related to Brad. The reason is that both Annabel and Brad have directly related transactions. You can show the value for these nodes by implementing a more complex test, checking whether a leaf node has related transactions. The final Sales Amount measure considers all of these conditions, and its result is shown in Figure 13.
[Sales Amount] :=
IF (
    [BrowseDepth] > [MaxNodeDepth] + 1,
    BLANK (),
    IF (
        [BrowseDepth] = [MaxNodeDepth] + 1,
        IF (
            AND (
                VALUES ( Nodes[IsLeaf] ) = FALSE,
                SUM ( Transactions[Amount] ) <> 0
            ),
            SUM ( Transactions[Amount] ),
            BLANK ()
        ),
        SUM ( Transactions[Amount] )
    )
)
Returns a string which contains a delimited list of IDs, starting with the top/root of a hierarchy and ending with the specified ID.
PATH ( <ID_ColumnName>, <Parent_ColumnName> )
Returns the nth item in the delimited list produced by the Path function.
PATHITEM ( <Path>, <Position> [, <Type>] )
Returns returns the number of items in a particular path string. This function returns 1 for the path generated for an ID at the top/root of a hierarchy.
PATHLENGTH ( <Path> )
Retrieves a value from a table.
LOOKUPVALUE ( <Result_ColumnName>, <Search_ColumnName>, <Search_Value> [, <Search_ColumnName>, <Search_Value> [, … ] ] [, <Alternate_Result>] )
Rounds a number down to the nearest integer.
INT ( <Number> )
This pattern is designed for Excel 2010-2013. An alternative version for Power BI / Excel 2016-2019 is also available.
This pattern is included in the book DAX Patterns 2015.

Downloads
Download the sample files for Excel 2010-2013: