Static Segmentation

The Static Segmentation pattern groups a continuous numeric value in a finite number of clusters by using a configuration defined in a parameter table (see also Parameter Table pattern). The static segmentation happens in a calculated column that is useful when you want to filter and group data according to the range of values. The parameter table is invisible and used only to control the segmentation algorithm.
You can use a similar approach to control a classification algorithm driven by a separate parameter table. Because the result of the segmentation process is not dynamic (it is stored in a calculated column), this parameter table also is invisible and is used only to avoid storing fixed parameters in DAX expressions. You should use the Dynamic Segmentation pattern, which uses measures, not calculated columns, to perform dynamic calculation.
Basic Pattern Example
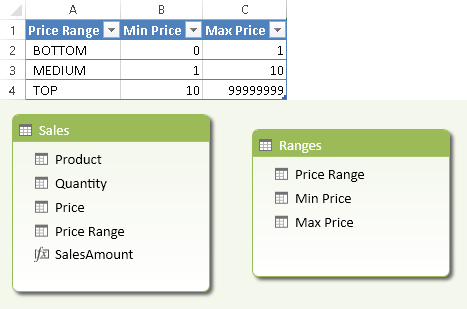
Suppose you want to slice data by price, grouping price values in ranges that you can customize by changing a configuration table. To do that, you must first create a Ranges table that does not have any relationship with other tables in the data model, as shown in Figure 1.
You create a calculated column in the table containing the price you want to segment, as shown in Figure 2.
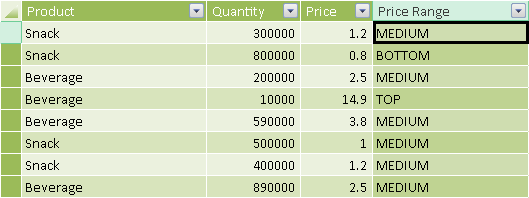
The DAX expression of the Price Range calculated column returns the description of the range to which the current price belongs.
[Price Range] =
CALCULATE (
    VALUES ( Ranges[Price Range] ),
    FILTER (
        Ranges,
        Sales[Price] >= Ranges[Min Price]
        && Sales[Price] < Ranges[Max Price]
    )
)
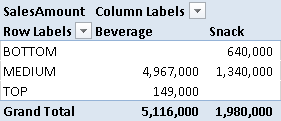
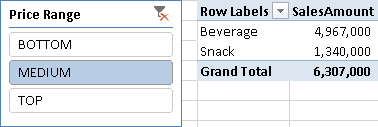
You can use calculated column like this as a filter in a PivotTable, as shown in Figure 3.
The static segmentation pattern is not dynamic because it uses calculated columns. If you want a dynamic behavior based on measures other than columns, use the Dynamic Segmentation pattern.
Use Cases
You can use the Static Segmentation pattern any time you need to reduce the number of values in a column in order to group data by a smaller number of elements, using a configuration table to define the number and the boundaries of the groups. This technique is also known as banding. Some interesting use cases are shown below.
Classify Items by Attribute Value
You can apply the Static Segmentation pattern to a table that represents an entity, such as Products, Customers, and so on. In a star schema, such a table is called a dimension table. A few practical examples are:
- Group Products by Price
- Group Customers by Age
- Group Countries by Population
Group Transactions by Value
You can group transactions according to the value of a column—for example, grouping sales by price. In a star schema, such a table is called a fact table. This approach is recommended whenever the values of the columns might be different for every row, regardless of other attributes. For example, if a product can have different prices in different transactions, you will create a calculated column in the Sales table instead of the Products table, because you want to use the transaction price instead of the product list price. A few practical examples are:
- Group Orders by Price
- Group Sales by Gross Margin
- Group Purchases by Discount
Complete Pattern
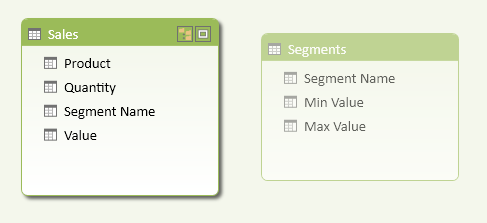
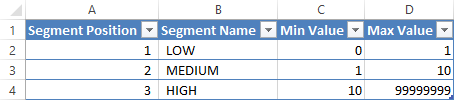
Add a Segments table to the data model, as shown in Figure 5. That table has no relationships with other tables, and usually has at least three columns: the range description and the minimum and maximum values for the range. You might use another column to specify a particular display order by using the Sort By Column property. You should hide the Segments table by using the Hide From Client Tools command on the table (available in either Grid or Diagram view).
You create a calculated column (Segment Name in the Sales table in Figure 7-5) that evaluates the corresponding segment for each row of the table containing the value to segment (the Value column in this case). You use the VALUES function in the DAX expression of the calculated column that looks for the corresponding range of values in the Segments table.
[Segment Name] =
CALCULATE (
    VALUES ( Segments[Segment Name] ),
    FILTER (
        Segments,
        Sales[Value] >= Segments[Min Value]
        && Sales[Value] < Segments[Max Value]
    )
)
If you have a misconfigured table with many segments that include the value of one row in the Sales table, you will get a calculation error in the calculated column. The error will propagate to all the rows of the Sales table, regardless of the rows that generate an invalid value. To avoid this runtime error, you can use the IFERROR statement. In the following example, the string returned in case of an error starts with an angle bracket, so that it will display at the beginning of a sorted list, highlighting the presence of an incorrect configuration in the Segments table.
[Segment Name] =
IFERROR (
    CALCULATE (
        VALUES ( Segments[Segment Name] ),
        FILTER (
            Segments,
            Sales[Value] >= Segments[Min Value]
            && Sales[Value] < Segments[Max Value]
        )
    ),
    "<config error>"
)
If you want to display the segments in a particular sort order, you can create a Segment Position column in the Segments and Sales tables, as shown in Figure 6.
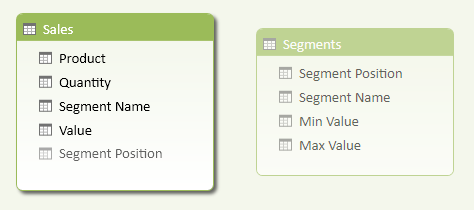
The Segment Position column in the Segments table must have the same cardinality as the Segment Name column.
You can copy the Segment Position column in the Sales table by using a statement similar to the one you used for Segment Name:
[Segment Position] =
IFERROR (
    CALCULATE (
        VALUES ( Segments[Segment Position] ),
        FILTER (
            Segments,
            Sales[Value] >= Segments[Min Value]
            && Sales[Value] < Segments[Max Value]
        )
    ),
    -1
)
In case of an error, you return -1, so that the error message will display at the beginning of a sorted list. You might consider using the Segment Position column to create a relationship between the two tables, making the Segment Name visible in the Segments table. However, such a relationship might be expensive in terms of memory usage, so consider this option only if the Segments table has a high number of values (in the order of thousands). Perform some memory size and performance tests before using the relationship.
More Pattern Examples
There are no other relevant examples for this pattern.
When a column name is given, returns a single-column table of unique values. When a table name is given, returns a table with the same columns and all the rows of the table (including duplicates) with the additional blank row caused by an invalid relationship if present.
VALUES ( <TableNameOrColumnName> )
Returns value_if_error if the first expression is an error and the value of the expression itself otherwise.
IFERROR ( <Value>, <ValueIfError> )
This pattern is designed for Excel 2010-2013. An alternative version for Power BI / Excel 2016-2019 is also available.
This pattern is included in the book DAX Patterns 2015.


Downloads
Download the sample files for Excel 2010-2013: