Cumulative Total

The Cumulative Total pattern allows you to perform calculations such as running totals, and you can use it to implement warehouse stock and balance sheet calculations using the original transactions instead of using snapshots of data over time.
For example, in order to create an Inventory table that shows the stock of each product for every month, you can make the same calculation using the original warehouse movements table, without processing and consolidating data in advance.
Basic Pattern Example
Suppose you want to calculate the monthly cumulative sum of the transaction quantities. The data model has a Date table that is marked as a Date table. In Figure 1, the Transactions table has a relationship with the Date table. You might have more relationships between the tables, but this would not change the DAX measure for this pattern.
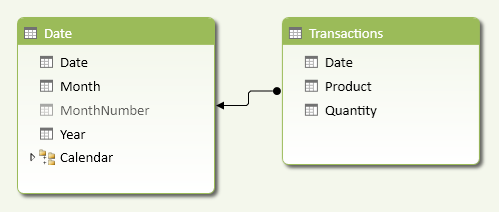
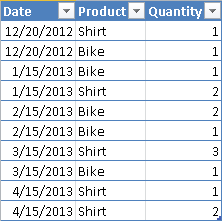
Figure 2 shows a sample Transactions table, with a few transactions for every month.
As shown in Figure 3, you compute the cumulative quantity, which is similar to a running total of the Sum of Quantity measure.
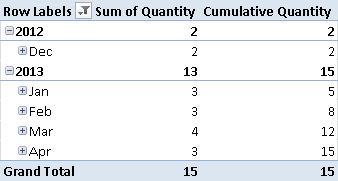
At any given date, the Cumulative Quantity measure displays the Sum of Quantity for all the transactions made on a date that is less than or equal to the selected date. For example, the Cumulative Quantity of February 2013 corresponds to the sum of December 2012, January 2013, and February 2013.
You define the Cumulative Quantity measure as follows:
Cumulative Quantity :=
CALCULATE (
    SUM ( Transactions[Quantity] ),
    FILTER (
        ALL ( 'Date'[Date] ),
        'Date'[Date] <= MAX ( 'Date'[Date] )
    )
)
The FILTER function returns the list of all the dates that are less than or equal to the last date in the current selection. Every cell of the PivotTable in Figure 3 has a different selection of dates. You apply the filter to the Date column of the Date table, which must be marked as a Date table in the data model.
Use Cases
You can use the Cumulative Total pattern whenever you want to show the total of a measure up to a certain date, considering all the previous operations (even those earlier than the current selection of dates). You might solve similar problems by creating a snapshot table, which calculates the value of a certain entity at a particular point in time. Moving this calculation at query time saves memory, but you might have a slower response at that time. The granularity of the Cumulative Total pattern is always the same as that of the Transactions table, without requiring additional storage. You have to evaluate the convenience of the Cumulative Total pattern on a case-by-case basis.
Inventory Stock
Providing inventory stock information usually requires a snapshot table that persistently holds the stock availability for each product and each day. In order to save space, you might have a different granularity of the snapshot table, defined at weekly or monthly level instead of daily. You can implement the Inventory Stock calculation as a dynamic calculation in DAX, using the Movements table as a Transactions table in the Cumulative Total pattern.
Balance Sheet
You can evaluate the numbers in balance sheet accounts (assets, liabilities, equity) by aggregating all the transactions using the Cumulative Total pattern. Most transactional systems already have a built-in calculation for these accounts that saves the updated cumulative value to the accounts involved in each transaction. You can use the Cumulative Total pattern to rebuild the historical or predicted behavior at any given granularity.
Cumulative Balance
It is common to implement the cumulative balance as a year-to-date calculation. In some cases, however, you might want to calculate the cumulative balance without year boundaries—for example, if you want to display trends and forecast analysis beyond the limit of the year. You can use or adapt the Cumulative Quantity pattern to this purpose.
Complete Pattern
You apply the Cumulative Total pattern to models that have a table marked as a Date table in the data model. The calculation extends the period to include all the dates before the period selected. To ensure correct results, choose the date column from the correct table (the one marked as a Date table).
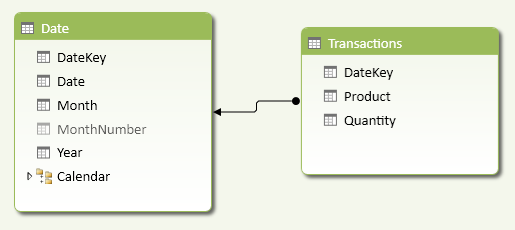
Figure 4 shows a data model where the relationship between the Transactions table and the Date table is defined using an integer column (DateKey). The Date table is marked as a Date table in the data model by use of the Date column.
In order to avoid displaying a value when the selected period is greater than any date in the Transactions table, you can apply a conditional statement that checks this condition. In the following Cumulative Quantity measure, you compare the minimum DateKey value of the selected period with the maximum value of the DateKey in the entire Transactions table.
Cumulative Quantity :=
IF (
    MIN ( 'Date'[DateKey] )
        <= CALCULATE ( MAX ( Transactions[DateKey] ), ALL ( Transactions ) ),
    CALCULATE (
        SUM ( Transactions[Quantity] ),
        FILTER (
            ALL ( 'Date'[Date] ),
            'Date'[Date] <= MAX ( 'Date'[Date] )
        )
    )
)

Cumulative Quantity Unchecked :=
CALCULATE (
    SUM ( Transactions[Quantity] ),
    FILTER (
        ALL ( 'Date'[Date] ),
        'Date'[Date] <= MAX ( 'Date'[Date] )
    )
)
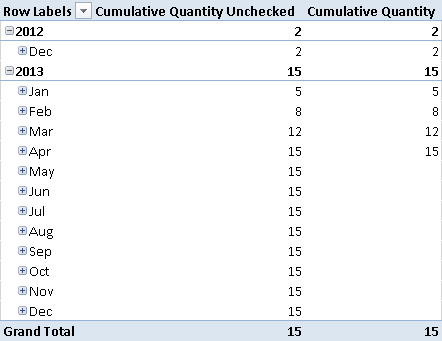
In this pattern, you compare the two columns that define the relationship between the tables; you will adapt this comparison to the columns used in your data model. Thanks to this check, you avoid the propagation of the last value in periods that are later than the last transactions in your data. In Figure 5, you can see that the unchecked calculation propagates the April 2013 value to all the following months, whereas the checked version returns blank when there are no more transactions available.
More Pattern Examples
You can easily apply the Cumulative Total pattern to the examples described earlier. The following section discusses the Inventory Stock calculation in more detail.
Inventory Valuation
You can apply the general Cumulative Total pattern to the Inventory Stock calculation. The Movements table corresponds to the Transactions table. If you want to calculate an inventory valuation, you need to calculate the unit price for each product at any given point in time. If you create a snapshot table containing the unit price for each product on each day, you probably will use the same table to store the inventory stock. Thus, you will use the Cumulative Total pattern only when you can dynamically calculate in a DAX expression the product unit price for any given day.
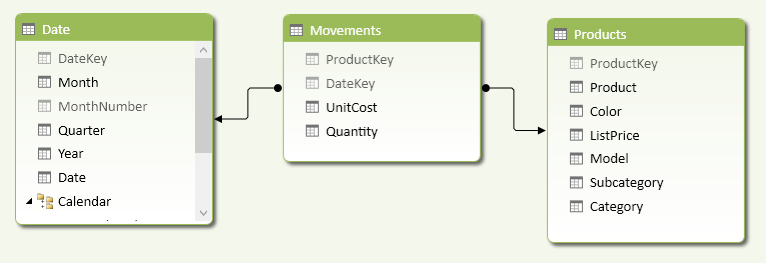
Consider the data model in Figure 6: every row in the Movements table has a Quantity and a UnitCost. Negative values in Quantity identify sales, whereas positive values in Quantity identify purchases. The related UnitCost in the same row is either the sale or purchase price, respectively.
You have to calculate the inventory value product by product, because each product might have a different price. Industries that share the same price for categories of products might apply a different calculation granularity. In order to obtain an aggregated value, you have to implement the following measure:
[Value] :=
SUMX (
    VALUES ( Products[ProductKey] ),
    [ProductPrice] * [UnitsInStock]
)
The SUMX function iterates over all the products selected. It is important to iterate over the ProductKey column in the Products table, instead of using the ProductKey column in the Movements table, because the latter would ignore products without transactions in the considered period. For each product, you multiply two other measures: UnitsInStock and ProductPrice.
You can implement the UnitsInStock measure by applying the Cumulative Total pattern:
UnitsInStock :=
IF (
    MIN ( 'Date'[DateKey] )
        <= CALCULATE ( MAX ( Movements[DateKey] ), ALL ( Movements ) ),
    CALCULATE (
        SUM ( Movements[Quantity] ),
        FILTER (
            ALL( 'Date'[Date] ),
            'Date'[Date] <= MAX ( 'Date'[Date] )
        )
    )
)
The ProductPrice implementation depends on the inventory valuation method that you want to apply. For example, you can calculate the last buy price with the following measure:
LastBuyPrice :=
IF (
    HASONEVALUE ( Products[ProductKey] ),
    AVERAGEX (
        CALCULATETABLE (
            TOPN (
                1,
                Movements,
                Movements[DateKey]
            ),
            Movements[Quantity] > 0,
            FILTER (
                ALL ( 'Date'[Date] ),
                'Date'[Date] <= MAX ( 'Date'[Date] )
            )
        ),
        Movements[UnitCost]
    )
)
The LastBuyPrice measure works if only one product is selected. It calculates the average value of UnitCost for the rows in the Movements table of the selected product in the last day of movement until the selected period. The TOPN function returns all the movements of the product in the last day available, and the AVERAGEX function returns an average of the UnitCost if there are more rows in the same day. Quantity is filtered to consider only purchases, which are positive numbers in Movements. In a similar way, you can implement the LastSellPrice by changing the filter for Quantity and considering only negative values, as shown in the following example:
LastSellPrice :=
IF (
    HASONEVALUE ( Products[ProductKey] ),
    AVERAGEX (
        CALCULATETABLE (
            TOPN (
                1,
                Movements,
                Movements[DateKey]
            ),
            Movements[Quantity] < 0,
            FILTER (
                ALL ( 'Date'[Date] ),
                'Date'[Date] <= MAX ( 'Date'[Date] )
            )
        ),
        Movements[UnitCost]
    )
)
The sample workbook contains two measures (ValueBuy and ValueSell) that implement the Value measure by replacing ProductPrice with LastBuyPrice and LastSellPrice, respectively.
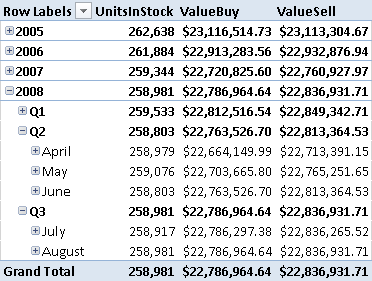
In Figure 7, you can see the result using a sample set of data loaded from the AdventureWorks database. The Buy and Sell values are different (although the difference is not realistic due to the particular AdventureWorks data set used).
A more detailed analysis of the Inventory Stock calculation is available in this article on the SQLBI website: http://tinyurl.com/DaxInventoryStock. The article compares size and performance between a classic snapshot-based calculation and an equivalent implementation based on the Cumulative Total pattern. Choosing between these approaches depends on data volume and distribution and must be evaluated on a case-by-case basis.
Returns a table that has been filtered.
FILTER ( <Table>, <FilterExpression> )
Returns the sum of an expression evaluated for each row in a table.
SUMX ( <Table>, <Expression> )
Returns a given number of top rows according to a specified expression.
TOPN ( <N_Value>, <Table> [, <OrderBy_Expression> [, [<Order>] [, <OrderBy_Expression> [, [<Order>] [, … ] ] ] ] ] )
Calculates the average (arithmetic mean) of a set of expressions evaluated over a table.
AVERAGEX ( <Table>, <Expression> )
This pattern is designed for Excel 2010-2013. An alternative version for Power BI / Excel 2016-2019 is also available.
This pattern is included in the book DAX Patterns 2015.


Downloads
Download the sample files for Excel 2010-2013: