Handling Different Granularities

The Handling Different Granularities pattern is a technique to show and hide measures depending on the level of granularity of the underlying data. For example, you do not want to display a measure at the day level if it is a total for the month.
Basic Pattern Example
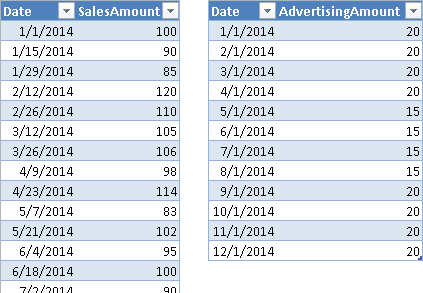
Suppose you have sales data at the day level and advertising expenses at the month level. The data source assigns the entire month’s advertising cost to the first day of each month, as shown in Figure 1.
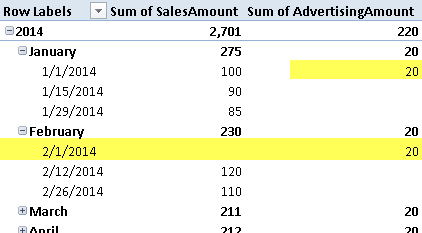
You have a common referenced Date table, based on the Date column. However, you do not want to display the sum of AdvertisingAmount at the day level, because this would produce the result in Figure 2. Such a display would suggest that the advertising happens only the first day of each month. You want to see the value of advertisements only at the month level, not at the day level.
You can create a measure that hides the value when there is a filter or selection at the day granularity level.
[Total Advertising] :=
IF (
    NOT ( ISFILTERED ( 'Date'[Date] ) ),
    SUM ( Advertising[AdvertisingAmount] )
)
The ISFILTERED function returns true if there is a filter active on the column specified in the argument. The Date table used in this example has only Year, Month, and Date columns. If you have other day columns, such as Day Number or Week Day Name, you should check whether a filter is active on these columns, too.
By using the Total Advertising measure, you do not show the value of advertising at the day level, as shown in Figure 3.
You use this technique whenever you want to show a calculation only at a valid granularity level.
Use Cases
You can use the Handling Different Granularities pattern whenever you want to hide a measure or the result of an expression, based on the current selection. For example, if you defined the budget at the month level, and you do not have an algorithm that allocates the monthly budget at the day level, you can hide the difference between sales and budget at the day level.
Compare Budget and Revenues
When you have a budget to compare with data, and the budget table does not have the same granularity as the other measures, you must accommodate the different granularities. This is common for time periods: the sales budget may be defined at the month or quarter level, whereas revenues are available at the day level. It happens also for other attributes, such as the product: the budget may be defined at the product category level, but not at the unit (SKU) level. Moreover, you probably have other attributes, such as the customer or the payment type, for which you do not have a budget definition at all.
You should hide measures that compare budget and revenues if the granularity is not available for both measures. For example, you should not display a key performance indicator (KPI) that shows the revenues vs. the planned goal if the user browsing data selects a single product (or day) but the budget is available only at the product category (or month) level. The Handling Different Granularities pattern helps you to implement this control. If you want to allocate the budget for higher granularities, you should consider the Budget pattern.
Compare Sales and Purchases
When you compare sales and purchases in the same data model, you probably have a different set of attributes for these measures. When certain attributes are selected, you cannot calculate a measure that evaluates the differences between cost and revenues. For example, you probably know the customer for the sales and the vendor for the purchases. If a report contains a selection of one or more customers, you might not be able to evaluate how much of the purchases are related to those sales. Thus, you hide the measure that compares sales and purchases if a selection is active on a customer or on a vendor.
Complete Pattern
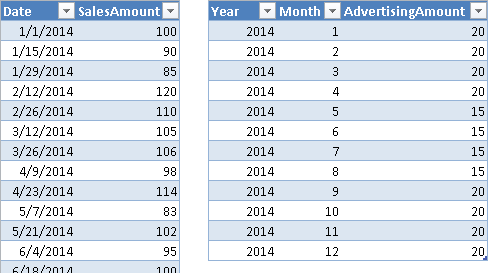
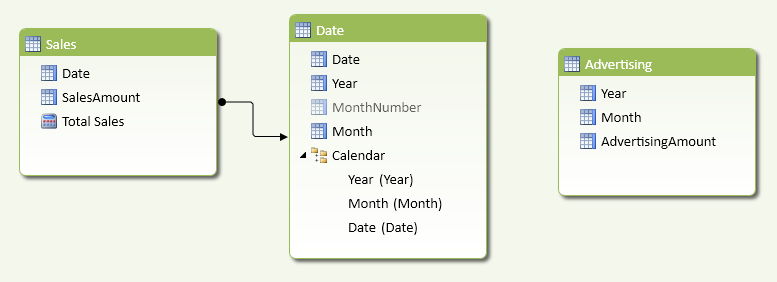
You have to handle data at different granularities when at least two tables contain different levels of stored information. For example, Figure 4 shows one table with SalesAmount recorded at the day level, whereas AdvertisingAmount is in another table with one value for each month.
If you import these tables in a data model and try to link them to a common Date table, it will not work. In fact, as you see in Figure 5, the Advertising table does not have a Date column available to create the relationship with the Date table.
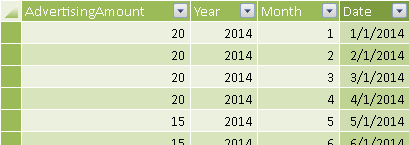
You can solve the problem by creating a fictitious date that allows you to define the missing relationship. Such a date could be the first day of the corresponding month. You define the calculated column Date in the Advertising table with the following formula. You can see the result in Figure 6.
[Date] =
DATE ( Advertising[Year], Advertising[Month], 1 )
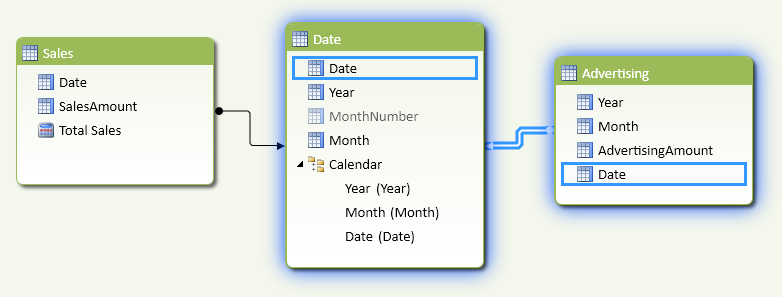
Once you have the Date column, you can create the relationship between Advertising and Date, as you see in Figure 7.
Since the Date you created is not a real one, when browsing data you should hide any measure derived from the Advertising table if the evaluation happens at the day level. The only valid levels are Month and Year. Thus, you have to define the Total Advertising measure by checking whether the Date column is filtered in the Date table or not:
[Total Advertising] :=
IF (
    NOT ( ISFILTERED ( 'Date'[Date] ) ),
    SUM ( Advertising[AdvertisingAmount] )
)
In case there was a WeekDay column or a MonthDayNumber in the Date table, you should include these columns in the test, as in the following example:
[Total Advertising] :=
IF (
    NOT (
        ISFILTERED ( 'Date'[Date] )
        || ISFILTERED ( 'Date'[WeekDay] )
        || ISFILTERED ( 'Date'[MonthDayNumber] )
    ),
    SUM ( Advertising[AdvertisingAmount] )
)
As a general pattern, you apply the following template to return a blank value when the current selection is not valid for the granularity of a measure, using these markers:
- <unchecked measure> is the original measure, which ignores the granularity of the query.
- <invalid_granularity_column_N> is a column that has more detail (higher granularity) than the one available for the <unchecked measure>.
[Checked Measure] :=
IF (
    NOT (
        ISFILTERED ( <invalid_granularity_column_1> )
        || ISFILTERED ( <invalid_granularity_column_2> )
        ...
        || ISFILTERED ( <invalid_granularity_column_N> )
    ),
    <unchecked measure>
)
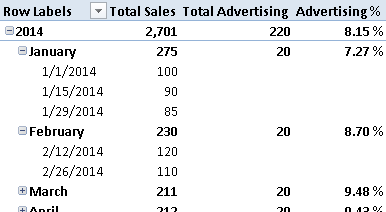
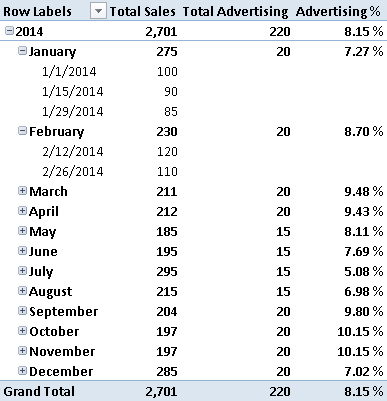
Once you have created a checked measure, other calculations based on that measure might avoid duplicating the test on granularity, as soon as the blank propagates into the result in the DAX expression used. For example, the Advertising% measure can be defined in this way, and returns blank when the Total Advertising is blank, as you see in Figure 8.
Advertising % := DIVIDE ( [Total Advertising], [Total Sales] )
More Pattern Examples
This section demonstrates how to handle different granularities without a relationship between tables.
Simulate a Relationship at Different Granularities
You can use DAX to filter data as if a relationship exists between two tables, even if there is no relationship between them in the data model. This is useful whenever a logical relationship does not correspond to a physical one.
The data model you use in DAX allows you to create relationships using only one column, which needs to be the key of the lookup table. When you have data at different granularities, you also have a logical relationship that would involve a hierarchical level not corresponding to the key of the lookup table. For instance, in the previous example of the pattern, you assign a specific date for a measure that has a month granularity (e.g., Advertising), and in order to display data in the correct way, you hide the measure when the user browses data at a day level instead of a month level. An alternative approach is to write a DAX measure that “simulates” a relationship between Advertising and Date tables at the month level.
The scenario is the same as was in Figure 5: the Advertising table cannot have a relationship with the Date table. This time, you do not create a fictitious Date column to create the relationship. Instead, you create a YearMonth column in both Date and Advertising table, so that you have a column representing the granularity of the logical relationship between the tables. You use a single column to simplify the required DAX code and improve performance.
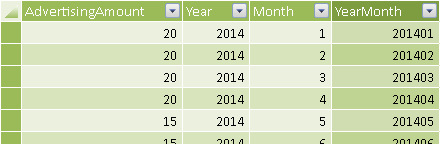
You define the YearMonth calculated column in the Advertising and Date tables as follows. The resulting Advertising table is shown in Figure 9.
Advertising[YearMonth] = Advertising[Year] * 100 + Advertising[Month]

'Date'[YearMonth] = 'Date'[Year] * 100 + 'Date'[MonthNumber]
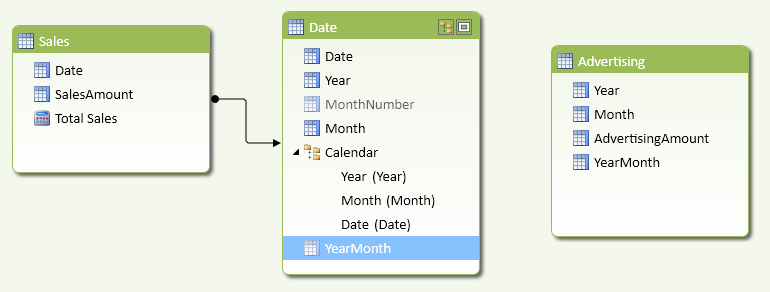
The YearMonth column exists in the Date and Advertising tables, but a physical relationship is not possible because you might have many rows with the same value in both tables. You might create a third table having YearMonth granularity, but this could be confusing for the user and would not help the calculation much. The resulting data model is the one shown in Figure 10.
The Total Advertising measure has to filter the sum of AdvertisingAmount using a CALCULATE function. You pass a filter argument with the list of YearMonth values that have to be included in the calculation, and you implement this using a FILTER that iterates all the YearMonth values in the Advertising table, keeping only those with at least a corresponding value in Date[YearMonth] that is active in the current filter context.
[Total Advertising] :=
IF (
    NOT ( ISFILTERED ( 'Date'[Date] ) ),
    CALCULATE (
        SUM ( Advertising[AdvertisingAmount] ),
        FILTER (
            ALL ( Advertising[YearMonth] ),
            CONTAINS  (
                VALUES ( 'Date'[YearMonth] ),
                'Date'[YearMonth],
                Advertising[YearMonth]
            )
        )
    )
)
When you browse the data, the result is the same as shown in Figure 8.
In general, you apply the following template to return a measure filtered by applying a logical relationship through columns that are not keys in any of the tables involved, using these markers:
- <target_measure> is the measure defined in the target table.
- <target_granularity_column> is the column that defines the logical relationship in the table that contains rows that should be filtered by the relationship.
- <lookup_granularity_column> is the column that defines the logical relationship in the lookup table, which should propagate the filter to the target table.
[Filtered Measure] :=
CALCULATE (
    <target_measure>,
    FILTER (
        ALL ( <target_granularity_column> ),
        CONTAINS  (
            VALUES ( <lookup_granularity_column> ),
            <lookup_granularity_column>,
            <target_granularity_column>
        )
    )
)
If you have many logical relationships, you pass one FILTER argument to CALCULATE for each relationship.
[Filtered Measure] :=
CALCULATE (
    <target_measure>,
    FILTER (
        ALL ( <target_granularity_column_1> ),
        CONTAINS  (
            VALUES ( <lookup_granularity_column_1> ),
            <lookup_granularity_column_1>,
            <target_granularity_column_1>
        )
    ),
    ...
    FILTER (
        ALL ( <target_granularity_column_N> ),
        CONTAINS  (
            VALUES ( <lookup_granularity_column_N > ),
            <lookup_granularity_column_N >,
            <target_granularity_column_N >
        )
    )
)
In the Total Advertising measure, you keep the initial IF statement that checks whether to display the data at the current selected granularity or not. If you omit this control, the value would be propagated to other granularities (e.g., you would see the monthly Advertising value repeated for all the days in the month).
Returns true when there are direct filters on the specified column.
ISFILTERED ( <TableNameOrColumnName> )
Evaluates an expression in a context modified by filters.
CALCULATE ( <Expression> [, <Filter> [, <Filter> [, … ] ] ] )
Returns a table that has been filtered.
FILTER ( <Table>, <FilterExpression> )
Checks whether a condition is met, and returns one value if TRUE, and another value if FALSE.
IF ( <LogicalTest>, <ResultIfTrue> [, <ResultIfFalse>] )
This pattern is designed for Excel 2010-2013. An alternative version for Power BI / Excel 2016-2019 is also available.
This pattern is included in the book DAX Patterns 2015.


Downloads
Download the sample files for Excel 2010-2013: