Budget

The budget patterns are techniques you use to compare budget information with other data. They are an extension of the handling of different granularities and, as such, use allocation algorithms to display the budget at granularities for which it is not available.
Basic Pattern Example
Suppose you have sales data at the day and product level, and the budget for each product at the year level, as shown in Figure 1.
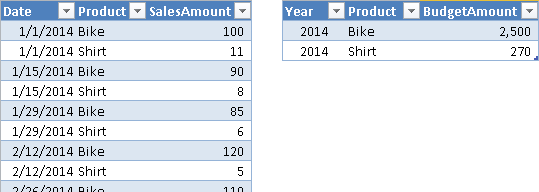
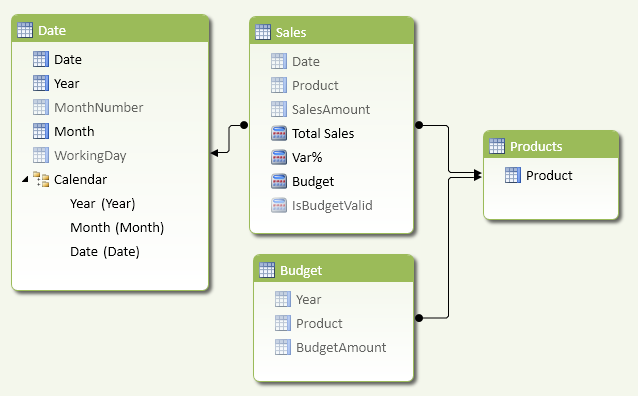
In the data model, both Sales and Budget tables reference the Products table through a relationship, because the product granularity is common to both Sales and Budget. Only the Sales table, however, references the Date table, because the Budget table cannot have a relationship using the Year column. Even if a “logical” relationship exists between Budget and Date at the year level, such a relationship does not exist as a physical one in the data model, as you see in Figure 2. The Date table also contains a WorkingDay flag, which is TRUE only for working days.
The Total Sales measure is a simple sum of the SalesAmount column in the Sales table.
[Total Sales] :=
SUM ( Sales[SalesAmount] )
You define the measures related to the budget in the Sales table, hiding the Budget table from the client tools. In this way, you will not have a warning about a missing relationship in the data model while browsing data.
Using the DAX function ISFILTERED, you check whether the current filter on Date has the same year granularity of the budget or if it has a higher granularity. When the granularity is different, the measure IsBudgetValid returns FALSE, and you need to allocate the budget on months or days.
[IsBudgetValid] :=
NOT (
    ISFILTERED ( 'Date'[Date] )
        || ISFILTERED ( 'Date'[Month] )
        || ISFILTERED ( 'Date'[MonthNumber] )
)
The Budget measure returns the sum of BudgetAmount if the budget granularity is compatible with the budget definition. If the granularity is different, then you must compute the budget using an allocation algorithm, which depends on business requirements. In this example, you allocate the same budget for each working day in the year. For each year, you calculate the ratio between the working days in the current filter and the total working days in the year. The SUMX function iterates over the years selected, and for each year retrieves the corresponding budget using a FILTER that simulates the relationship at the year granularity.
[Budget] :=
IF (
    [IsBudgetValid],
    SUM ( Budget[BudgetAmount] ),
    SUMX (
        VALUES ( 'Date'[Year] ),
        CALCULATE (
            COUNTROWS ( 'Date' ),
            'Date'[WorkingDay] = TRUE
        )
            / CALCULATE (
                COUNTROWS ( 'Date' ),
                ALLEXCEPT ( 'Date', 'Date'[Year] ),
                'Date'[WorkingDay] = TRUE
            )
            * CALCULATE (
                SUM ( Budget[BudgetAmount] ),
                FILTER ( ALL ( Budget[Year] ), Budget[Year] = 'Date'[Year] )
            )
    )
)
The variance between Total Sales and Budget is a trivial measure. Using DIVIDE, you avoid the division by zero error in case the budget is not available.
[Var%] :=
DIVIDE ( [Total Sales] - [Budget], [Budget] )
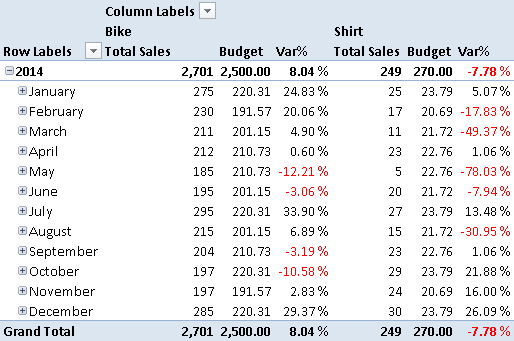
You can see the results of the Total Sales, Budget, and Var% measures in Figure 3. You split the budget by month according to the number of working days in each month.
You use this technique whenever you want to allocate a budget to a different granularity. If more tables are involved in the allocation, you will need to use a more complex pattern, as you will see in the Complete Pattern section.
Use Cases
You can use the budget patterns whenever you have a table with data of one granularity and you want to allocate numbers to a different granularity, based on an allocation algorithm that meets your business requirements.
Fixed Allocation of Budget over Time
If you want to evenly split a yearly budget into a monthly budget, you use a fixed allocation. For example, you divide the year value by 12 in order to obtain the monthly value, or you divide the year value by 365 (or 366 for leap years) and then multiply the result by the number of days in each month. In either case, you have an allocation that is deterministic and depends only on the calendar.
Budget Allocation Based on Historical Data
You might want to use historical data to allocate the budget over attributes that are not available as levels of the budget. For example, if you have a budget defined by product category, you can allocate the budget by product according to the ratio of sales between each product and the corresponding product category for the previous year. You can allocate the budget for multiple attributes at the same time—for example, also for the date, to obtain a seasonal allocation based on previous sales.
Complete Pattern
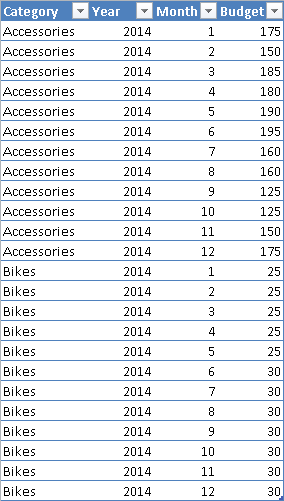
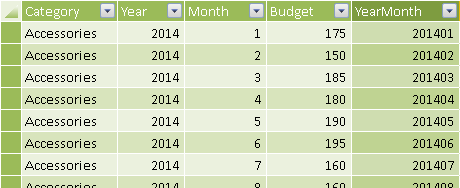
The Budget table and the measure it is being compared to may define data at different granularity levels. For example, the budget shown in Figure 4 is defined by product category and month/year, whereas the sales quantity is available by day, product, and territory. The budget does not include the territory at all.
The data model contains a Sales table with relationships to Date, Territory, and Product tables. As you see in Figure 5, the Budget table does not have any physical relationships, even though it has a logical relationship with Date (at the Month level) and Product (at the Category level).
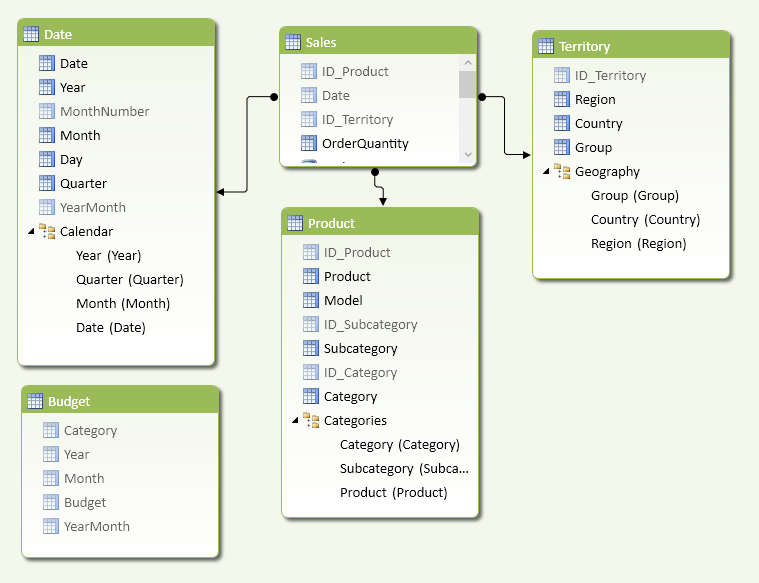
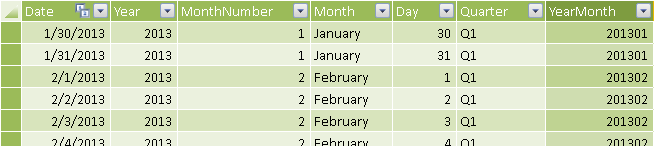
You need a single column in the Budget table for each logical relationship it has in the data model. For example, you need a single column to simplify calculation of the logical relationship between the Budget and Date tables. If you define a YearMonth calculated column in the Date table using Year and MonthNumber with the following formula, you will have a unique value for each year and month, as shown in Figure 6.
'Date'[YearMonth] =
'Date'[Year] * 100 + 'Date'[MonthNumber]
If you also define the same YearMonth column in the Budget table with the following formula, you see the result in Figure 7.
Budget[YearMonth] =
Budget[Year] * 100 + Budget[Month]
The Budget measure is calculated differently, depending on the granularity of the existing filter. You only need to apply budget allocation (AllocatedBudget) if the query requests a higher granularity than the one available in the budget definition; otherwise you can use a simpler (and faster) formula (BudgetCalc). You split the Budget calculation using other hidden measures, whereas Quantity and Var% are visible and simpler to define.
[Quantity] :=
SUM ( Sales[OrderQuantity] )
[Budget] :=
IF (
    [IsBudgetValid],
    [BudgetCalc],
    [AllocatedBudget]
)
[Var%] :=
DIVIDE ( [Quantity] - [Budget], [Budget] )
You can check whether the current filter has a granularity corresponding to the one available in the Budget table by counting the number of rows in the Sales table in two conditions: with the current filter context and by removing the filters on granularities that are not available in the budget itself. If the two numbers are different, than the budget is not valid at the granularity of the current filter context. You implement the IsBudgetValid measure with the following template, using these markers:
- <fact_table> is the table that contains the data used to calculate the measure that you will compare with the budget.
- <lookup_granularity_column> is a column in the lookup table that defines a logical relationship between the budget and an entity in the data model. For example, if you define the budget at the month level using two columns (Year and Month), then you use a YearMonth calculated column to define the logical relationship between Date and Budget tables.
[IsBudgetValid] :=
(
    COUNTROWS ( <fact_table> )
        = CALCULATE (
            COUNTROWS ( <fact_table> ),
            ALL ( <fact_table> ),
            VALUES ( <lookup_granularity_column_1> ),
            ...
            VALUES ( <lookup_granularity_column_N> )
        )
)
You have to include a filter argument in the CALCULATE function for each logical relationship you have between Budget and other tables. You implement the IsBudgetValid measure in the example by using YearMonth and Category columns, without specifying any filter argument for the columns in the Territory table, since it is not included in the budget definition.
[IsBudgetValid] :=
(
    COUNTROWS ( Sales )
        = CALCULATE (
            COUNTROWS ( Sales ),
            ALL ( Sales ),
            VALUES ( 'Date'[YearMonth] ),
            VALUES ( Product[Category] )
        )
)
If the filter context is compatible with the budget granularity, you calculate the budget by applying the filters defined by the existing logical relationships. This is the pattern described in the Simulate a Relationship at Different Granularities section of the Handling Different Granularities pattern. You define the BudgetCalc measure as follows:
[BudgetCalc] :=
CALCULATE (
    SUM ( Budget[Budget] ),
    FILTER (
        ALL ( Budget[YearMonth] ),
        CONTAINS (
            VALUES ( 'Date'[YearMonth] ),
            'Date'[YearMonth], Budget[YearMonth]
        )
    ),
    FILTER (
        ALL ( Budget[Category] ),
        CONTAINS (
            VALUES ( Product[category] ),
            Product[Category], Budget[Category]
        )
    )
)
When you need to allocate the budget to different granularities, you iterate over the granularity of the budget, applying an allocation factor to each value of the budget. You perform the iteration over the result of a CROSSJOIN of the logical relationships available in the Budget table. You can apply the following template, using this marker:
- <lookup_granularity_column> is the column that defines the logical relationship in the lookup table (a corresponding column exists in the Budget table).
[AllocatedBudget] :=
SUMX (
    KEEPFILTERS (
        CROSSJOIN (
            VALUES ( <lookup_granularity_column_1> ),
            ...
            VALUES ( <lookup_granularity_column_N> )
        )
    ),
    [AllocationFactor] * [BudgetCalc]
)
For example, you implement the AllocatedBudget measure in this scenario using the following definition:
[AllocatedBudget] :=
SUMX (
    KEEPFILTERS (
        CROSSJOIN (
            VALUES ( 'Date'[YearMonth] ),
            VALUES ( Product[Category] )
        )
    ),
    [AllocationFactor] * [BudgetCalc]
)
The calculation of the allocation factor is the core of the allocation algorithm. You evaluate the ratio of a reference measure between its value calculated in the current filter context and its value calculated in the available granularity of the budget. The denominator of the ratio uses a CALCULATE function that applies a filter argument for each table that has a direct relationship with the data that are used to calculate the reference measure. You can apply the following template, using these markers:
- <reference_measure> is the measure used as a reference to calculate the allocation of the budget.
- <filter_budget_granularity_N> is a set of filter arguments in the CALCULATE function that remove the part of the filter context defining a granularity higher than the one available for the budget.
[AllocationFactor] :=
<reference_measure>
    / CALCULATE (
        <reference_measure>,
        <filter_budget_granularity_1>,
        ...
        <filter_budget_granularity_N>
    )
The reference measure might correspond to the actual value that the budget is compared with, but calculated in a different period (e.g., budget sales allocated according to the sales of the previous year), or it could be another measure calculated in the same period (e.g., budget costs allocated according to the revenues of the same period).
Each filter argument you pass to the CALCULATE statement in the denominator of the AllocationFactor measure has to remove the parts of the filter context that are not available in the granularity of the budget. For example, if you have the budget by month and product category, you have to remove the filters for day, product name, and product subcategory, so that the remaining filters match the budget granularity. You apply a different technique for each table that has a direct relationship with the table containing data used by the measure. In the data model of this example, the Quantity measure sums the QuantitySold column from the Sales table, so you consider only the tables having a relationship with Sales: Date, Product, and Territory.
Three different filter-removal templates are available, depending on the logical relationship of each table with the budget:
- ALLEXCEPT removes the filters from the columns that have a higher granularity than the one available in the budget, for the tables that have a logical relationship with the budget.
ALLEXCEPT ( <table>, <lookup_granularity_column> )
ALL ( <table> ), VALUES ( <lookup_granularity_column> ) )
ALL ( <table> )
The markers used in the previous templates are the following:
- <table> is the table considered for filter removal; it has a direct relationship with the table containing data used by the measure implementing the allocation algorithm.
- <lookup_granularity_column> is a column of the table that has a granularity corresponding to the granularity of the budget (e.g., YearMonth in the Date table in the previous example). You keep these columns in the filter context, removing all the other columns of the same table.
You apply an ALLEXCEPT or ALL / VALUES template for each lookup granularity column you have in the CROSSJOIN arguments of the AllocatedBudget measure, and you apply the ALL template to all the other tables involved.
In this example, you allocate the budget based on the quantity sold in the previous year, which is the QuantityPY reference measure. You remove the filter from all the Product columns except for Category and ID_Category (these columns have the same granularity). You also remove the filters from all the Date columns except for YearMonth, using the ALL / VALUES template instead of ALLEXCEPT because the table is marked as Date table. The special behavior of DAX for Date tables requires a different approach than ALLEXCEPT, which would not produce correct results in this particular case. Finally, you apply the ALL template to the Territory table, which has a relationship with Sales, but is not part of the budget granularity.
You implement the AllocationFactor and QuantityPY measures using the following definitions:
[AllocationFactor] :=
[QuantityPY]
    / CALCULATE (
        [QuantityPY],
        ALLEXCEPT (
            Product,
            Product[Category],
            Product[ID_Category]
        ),
        ALL ( 'Date' ), VALUES ( 'Date'[YearMonth] ),
        ALL ( Territory )
    )
[QuantityPY] :=
CALCULATE (
    [Quantity],
    SAMEPERIODLASTYEAR ( 'Date'[Date] )
)
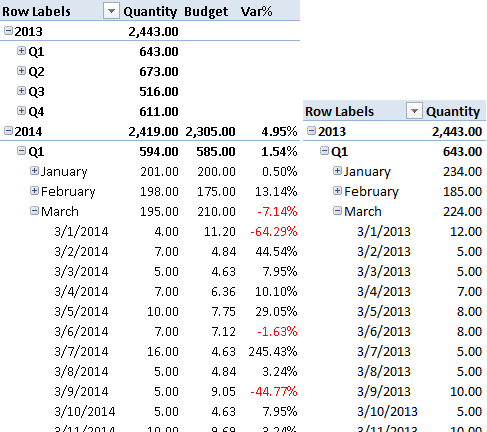
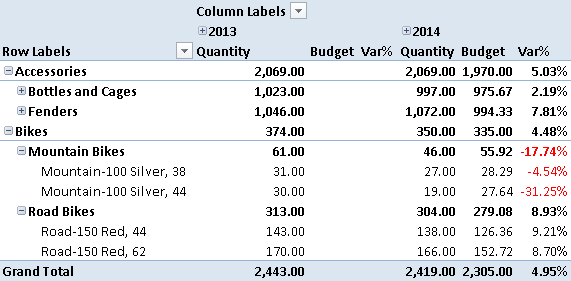
You test the budget calculation for all the columns involved in allocation. The budget defined by year and month aggregates value at the year and quarter level, whereas it allocates the month value at the day level. For example, the budget in March 2014 allocates by day using the quantity sold in March 2013, as you see in Figure 8.
The budget allocation per Subcategory and Product in 2014 uses the quantity sold in 2013, as you see in Figure 9.
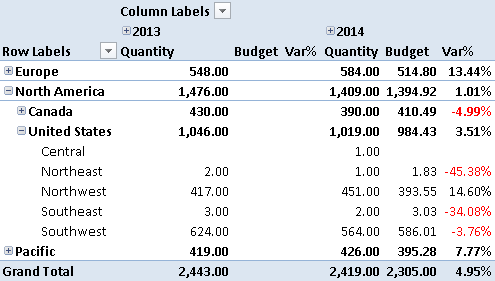
The budget allocation per Territory in 2014 uses the quantity sold in 2013, as you see in Figure 10.
Returns true when there are direct filters on the specified column.
ISFILTERED ( <TableNameOrColumnName> )
Returns the sum of an expression evaluated for each row in a table.
SUMX ( <Table>, <Expression> )
Returns a table that has been filtered.
FILTER ( <Table>, <FilterExpression> )
Safe Divide function with ability to handle divide by zero case.
DIVIDE ( <Numerator>, <Denominator> [, <AlternateResult>] )
Evaluates an expression in a context modified by filters.
CALCULATE ( <Expression> [, <Filter> [, <Filter> [, … ] ] ] )
Returns a table that is a crossjoin of the specified tables.
CROSSJOIN ( <Table> [, <Table> [, … ] ] )
Returns all the rows in a table except for those rows that are affected by the specified column filters.
ALLEXCEPT ( <TableName>, <ColumnName> [, <ColumnName> [, … ] ] )
Returns all the rows in a table, or all the values in a column, ignoring any filters that might have been applied.
ALL ( [<TableNameOrColumnName>] [, <ColumnName> [, <ColumnName> [, … ] ] ] )
When a column name is given, returns a single-column table of unique values. When a table name is given, returns a table with the same columns and all the rows of the table (including duplicates) with the additional blank row caused by an invalid relationship if present.
VALUES ( <TableNameOrColumnName> )
This pattern is designed for Excel 2010-2013. An alternative version for Power BI / Excel 2016-2019 is also available.
This pattern is included in the book DAX Patterns 2015.


Downloads
Download the sample files for Excel 2010-2013: