Transition matrix
The Transition matrix pattern analyzes changes in an attribute assigned to an entity at regular intervals. For example, customers might receive a ranking evaluation every month, or products might have a rating score measured every week. Measuring the changes in rating between two points in time might require the evaluation of how many items moved from one rating to another within the considered interval. The transition matrix enables the end user to make this kind of analysis by just manipulating filters in a report and without having to write any custom query.
Introduction
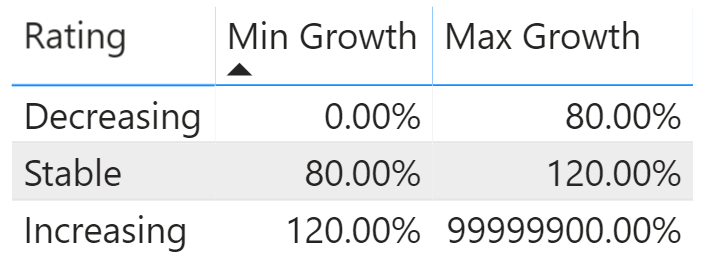
Each product is assigned a monthly rating based on the comparison between the percentage of sales in the current month and in the previous month. The configuration is depicted in Figure 1.
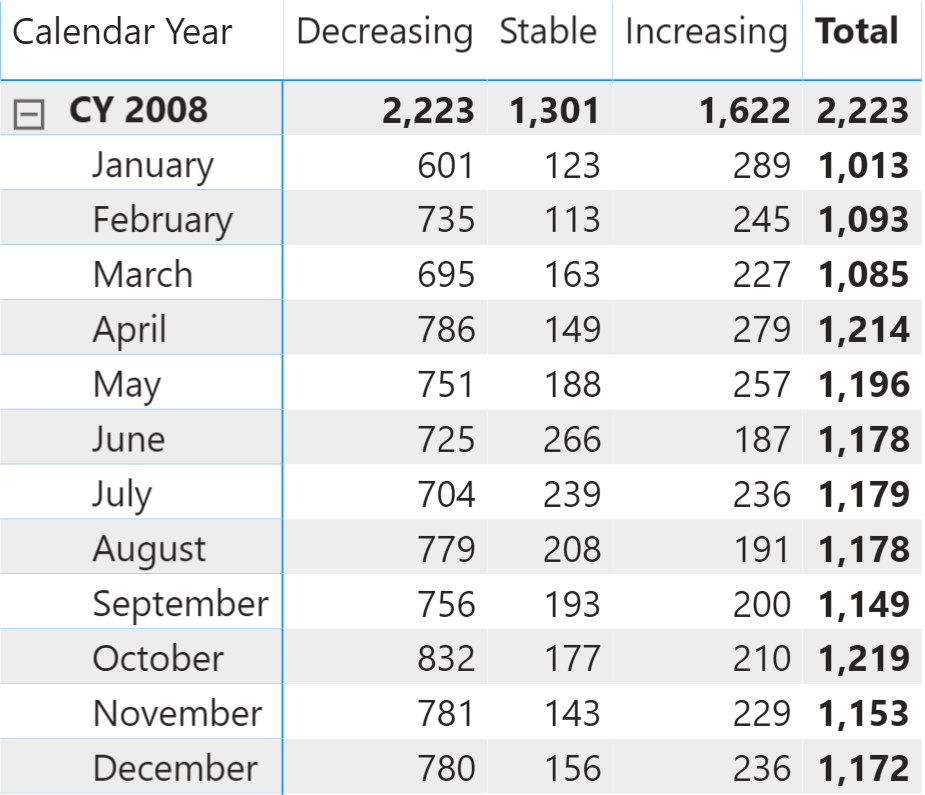
A simple implementation of the dynamic segmentation lets you analyze how many products fall under each rating every month, like in Figure 2.
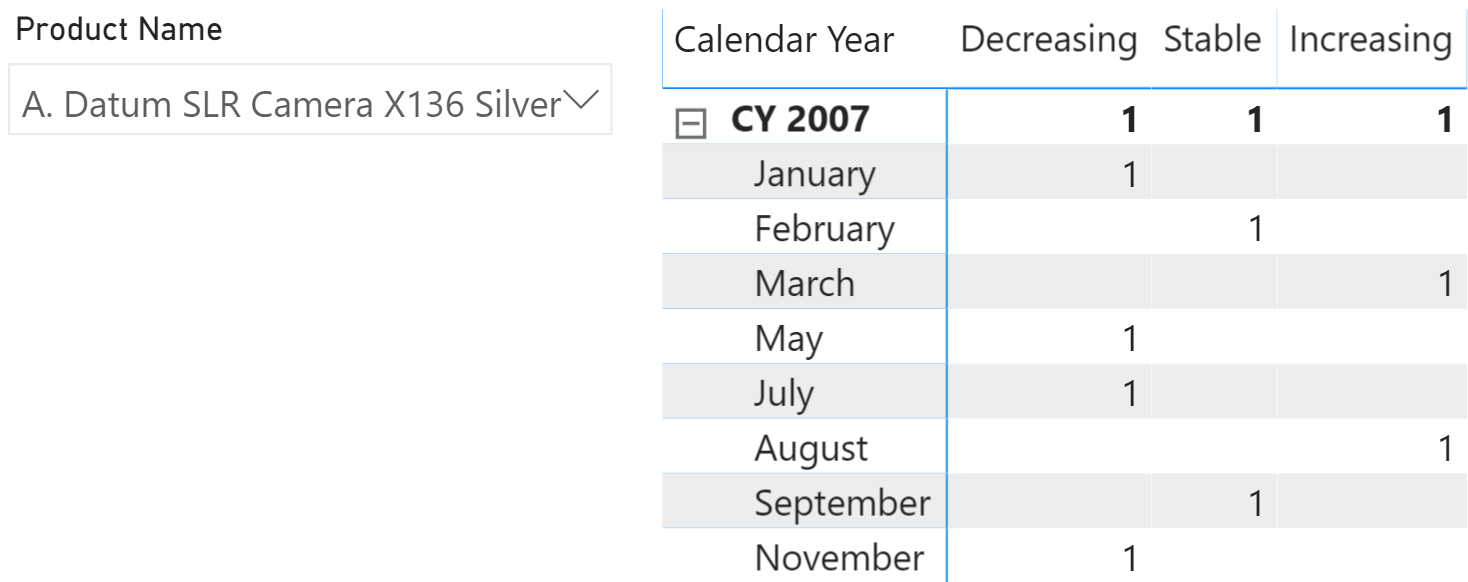
As you can imagine, one same product might be assigned different ratings over time. The same matrix in Figure 3, focusing on a single product, shows the situation for A. Datum SLR Camera.
From a broader point of view, an interesting analysis is: taking all the products that had a given rating in a starting month, how did they evolve over time? Has their rating improved or worsened in the following months? You can see the result in Figure 4.
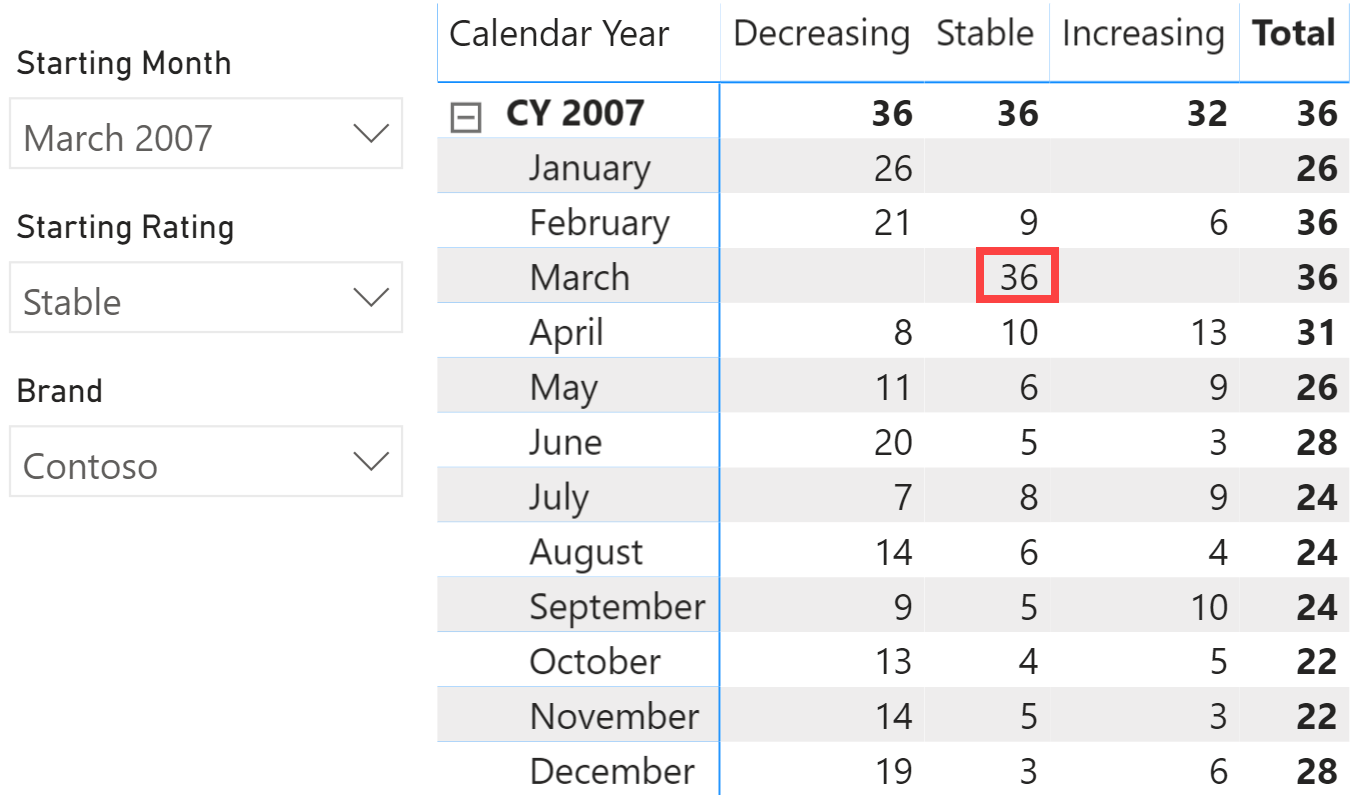
The report is showing that there are 36 products rated Stable in March 2007. The rating for that same set of products changes in different months, and a product only has a rating for months when there are sales. The number of products with a rating might thus change over time. In April for example, 8 out of the 36 products have a lower rating, 10 have the same rating, and 13 have a higher rating. 5 of the original 36 products have no rating in April 2007, because there were no sales for those 5 products. The products considered in April are only products with a rating in March 2007, the only change is their monthly rating and the 5 products without sales in April are not included because they have no rating in that month. The same reasoning applies to all the other months, always based on the 36 products that are Stable in March.
There are multiple ways of generating the transition matrix; here, we outline two possible solutions. The first solution is based on a snapshot table, generating a very fast static transition matrix. The second solution is based on pure DAX code, resulting in a slower but more flexible dynamic transition matrix.
Both patterns share some of the data modeling requirements. Therefore, we first explain the easier static transition matrix. Later on, we dive into more details with the dynamic transition matrix. In the dynamic transition matrix section, we will not repeat some of the details explained in the static transition matrix. Therefore, if you need to implement the dynamic transition matrix pattern, please review the static pattern first, in order to gather the required information on how to setup your model.
Static transition matrix
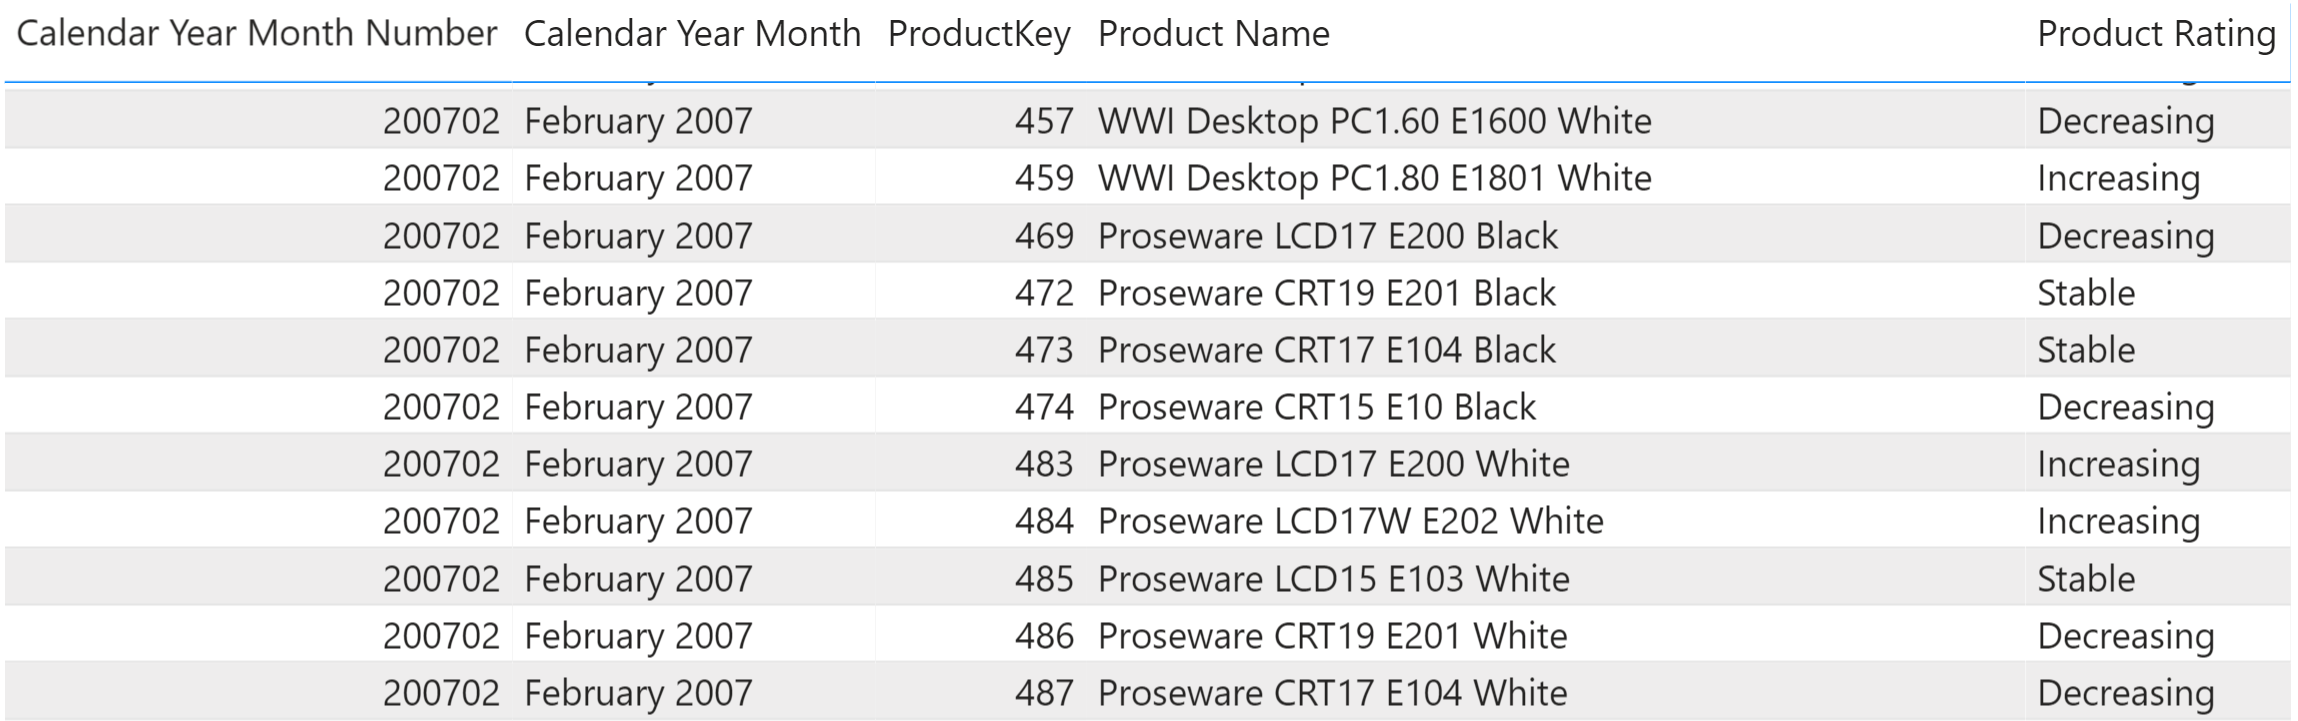
The static transition matrix uses a snapshot table containing the rating assigned to each product on a monthly basis. In the example provided, we generated this snapshot through a DAX calculated table. In your scenario, you might have the same information already provided in the data source. The important thing is that the table must contain the month, the product, and the rating assigned. In Figure 5 you can see an excerpt of the Monthly Ratings snapshot table.
The snapshot table is not enough to solve the scenario. We need two additional tables to enable the user to select a starting month and a starting rating. The user interface provided to the user is visible in Figure 6.
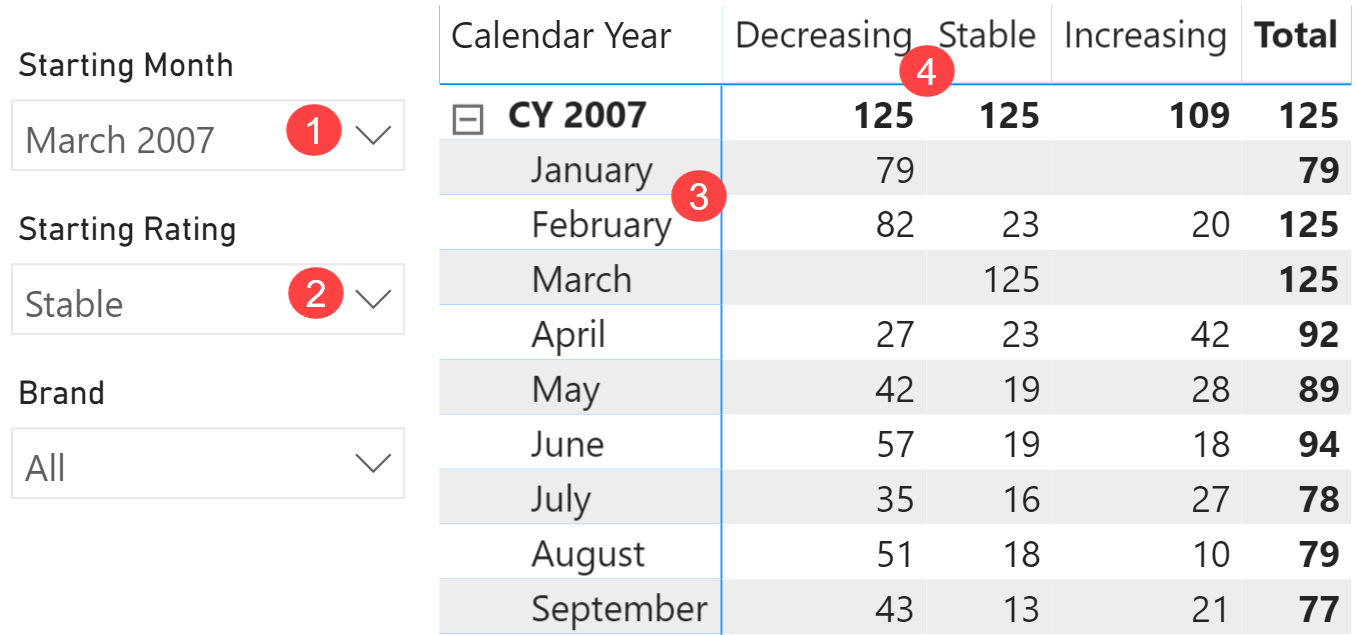
The slicer for Starting Month (1) cannot be based on the Date[Calendar Year Month] column. Indeed, the Date table is already used in the rows of the matrix (3). Therefore, the Date table cannot be filtered by an external slicer in order to show – for example – September 2007 even though the starting month is March 2007. Similarly, the slicer with the Starting Rating (2) cannot use the same snapshot rating attribute applied to the columns of the matrix (4). The columns of the matrix and the slicer must be fed by different tables.
We need two calculated tables for the slicers that we call Starting Month and Starting Rating:
Starting Month =
SELECTCOLUMNS (
    SUMMARIZE ( Sales, 'Date'[Calendar Year Month], 'Date'[Calendar Year Month Number] ),
    "Starting Month", 'Date'[Calendar Year Month],
    "Starting Month Sort", 'Date'[Calendar Year Month Number]
)
Starting Rating =
SELECTCOLUMNS (
    SUMMARIZE ( Rating, Rating[Rating], Rating[RatingKey] ),
    "Starting Rating", Rating[Rating],
    "Starting Rating Sort", Rating[RatingKey]
)
These two slicer tables are not linked with any of the other tables in the model. Only the DAX code will read their selection and use it to compute the result of the measures.
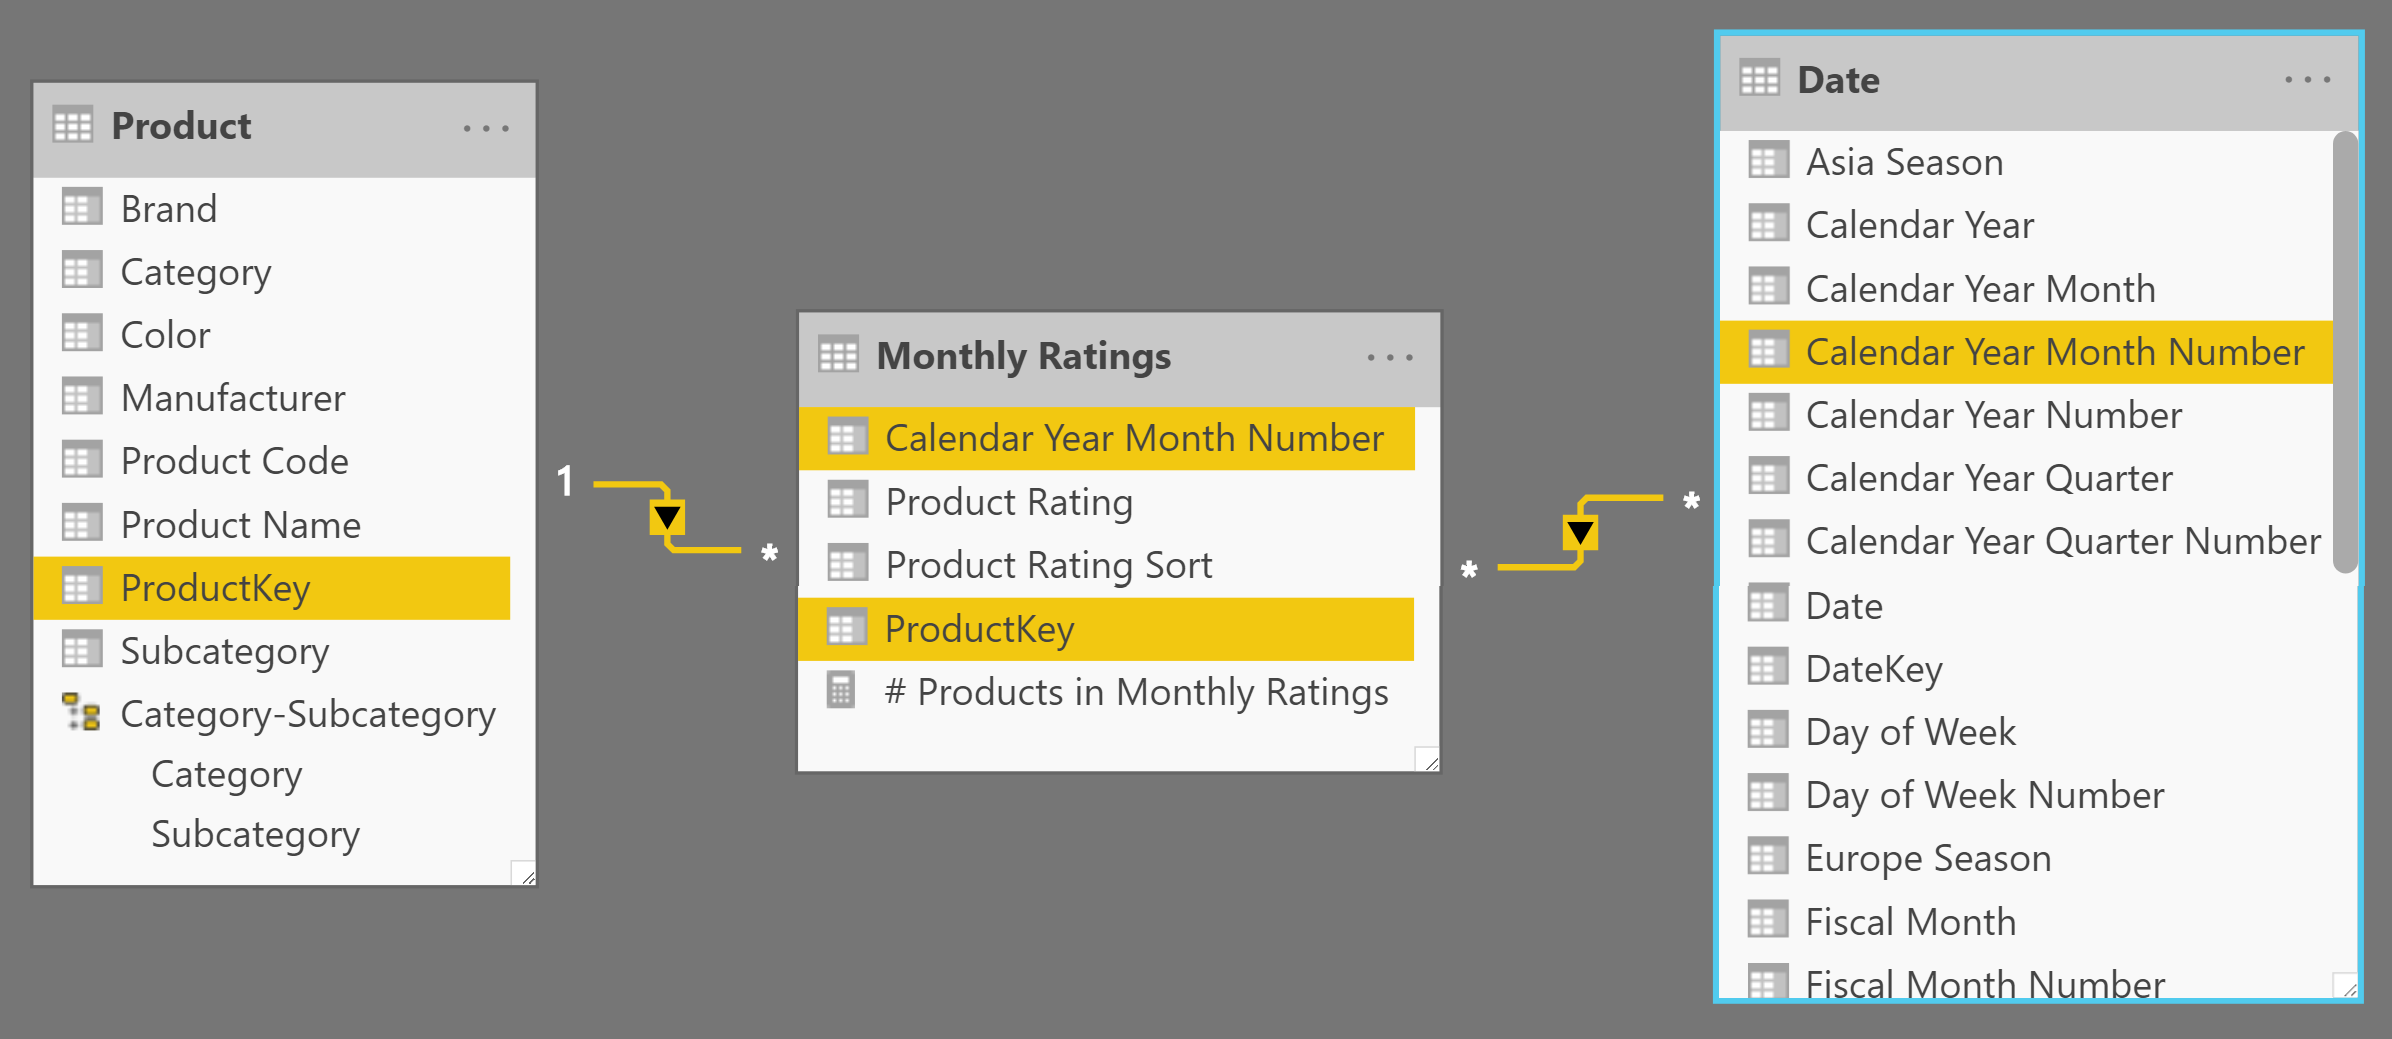
However, the snapshot tables must be linked with the remaining part of the model through appropriate relationships. In this example we use a weak many-to-many relationship with Date based on the Calendar Year Month Number column, and a simple one-to-many strong relationship with Product based on the ProductKey column. The diagram is visible in Figure 7.
Once the model is set, the DAX code must read the current selection on the two slicer tables and use the information to determine the list of products that – in the selected month – are in the selected status. Once the list of products is computed, it is used as a filter over the snapshot table in order to restrict the calculation strictly to the relevant products:
# Products Matrix :=
VAR SelectedStartingMonths =
    TREATAS (
        VALUES ( 'Starting Month'[Starting Month] ),
        'Date'[Calendar Year Month]
    )
VAR SelectedStartingRatings =
    TREATAS (
        VALUES ( 'Starting Rating'[Starting Rating] ),
        'Monthly Ratings'[Product Rating]
    )
VAR StartingProducts =
    CALCULATETABLE (
        VALUES ( 'Monthly Ratings'[ProductKey] ),
        SelectedStartingRatings,
        SelectedStartingMonths,
        REMOVEFILTERS ( 'Monthly Ratings'[Product Rating Sort] ),
        REMOVEFILTERS ( 'Date' )
    )
VAR Result =
    CALCULATE (
        DISTINCTCOUNT ( 'Monthly Ratings'[ProductKey] ),
        KEEPFILTERS ( StartingProducts )
    )
RETURN
    Result
Because the static transition matrix is based on a calculated table, its results are not dynamic. This means that if the user filters the customers in a specific country, the numbers in the transition matrix will not change. The only tables that affect the result are the ones linked through physical relationships with the snapshot. In this example these tables are Date and Product.
If you need a dynamic transition matrix that recomputes its result every time based on the current selection across the entire data model, then you need to implement the more powerful (albeit slower) dynamic transition matrix.
Dynamic transition matrix
The dynamic transition matrix solves the same scenario as the static transition matrix, with the noticeable difference that it does not require the snapshot table. Instead, it computes the result every time the measure is evaluated, resulting in a dynamic calculation.
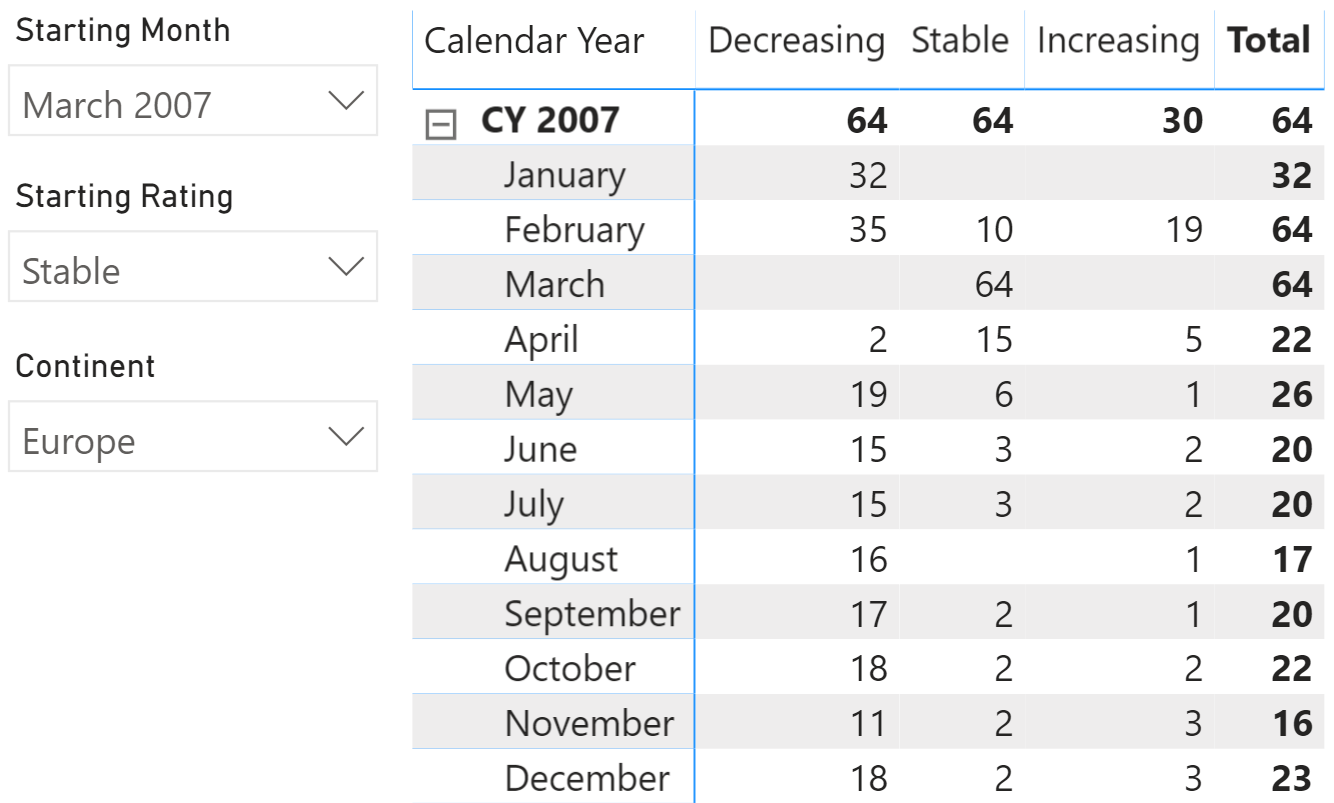
The data model is the same as the static transition matrix, but no snapshot table is required this time. The result is visible in Figure 8, where we added a slicer filtering one continent – the same slicer would have no effect on a static transition matrix.
Because the pattern requires computing the ranking of a product multiple times, this time we created a measure to return the rating of a product in a given month:
Status :=
CALCULATE (
    DISTINCT ( Rating[Rating] ),
    FILTER (
        ALLNOBLANKROW ( Rating ),
        VAR CurrentValue = [% Of Previous Month]
        VAR LowerBoundary = Rating[Min Growth]
        VAR UpperBoundary = Rating[Max Growth]
        RETURN
            AND ( CurrentValue >= LowerBoundary, CurrentValue < UpperBoundary )
    )
)
The final measure is quite intricate. It is divided into two separate steps:
- Compute the list of the products that are in one of the selected states and months, chosen by the user with the slicers. To perform this operation – since the ranking of each product is unknown at the beginning – the formula computes the ranking of each product and then filters out the ones that are not selected.
- Compute the status of the products computed earlier, this time in the current filter context. This second step is very similar to the previous one; the only important difference is in the filtering of dates and products, as better outlined in the code comments:
# Products Matrix Dynamic :=
VAR SelectedStartingMonths =                            -- First we save the
    TREATAS (                                           -- selected starting month
        VALUES ( 'Starting Month'[Starting Month] ),    -- as a Date column to make
        'Date'[Calendar Year Month]                     -- it filter Date, later on
    )
VAR SelectedStartingRatings =                           -- Save the currently selected
    VALUES ( 'Starting Rating'[Starting Rating] )       -- rating as the starting point
VAR CurrentRatings =                      -- Save the ratings of the current filter
    VALUES ( Rating[Rating] )             -- context (not the starting, the current ones)

VAR StartingProdsAndMonths =              -- We store the products and months
    CALCULATETABLE (                      -- of the starting time period in a variable
        SUMMARIZE (
            'Sales',
            'Product'[ProductKey],
            'Date'[Calendar Year Month]    -- Beware that the report is filtering
        ),                                 -- a different period. For this reason we
        SelectedStartingMonths,            -- need to remove the outer filter on date
        REMOVEFILTERS ( 'Date' )           -- and replace it with the starting month
    )
VAR StartingProdAndStatus =                -- Here we compute the Status assigned to
    CALCULATETABLE (                       -- the products in the starting months,
        FILTER (                           -- only keeping the products whose status
            StartingProdsAndMonths,        -- is among the selected starting ratings
            [Status] IN SelectedStartingRatings
        ),
        REMOVEFILTERS ( 'Date' )           -- Required to get rid of the original filter
    )
VAR StartingProductsInStatus =             -- Finally, we are only interested in the
    DISTINCT (                             -- product keys, so we remove other columns
        SELECTCOLUMNS (                    -- from the previous table
            StartingProdAndStatus,         -- This variable will only filter Product
            "ProductKey", 'Product'[ProductKey]
        )
    )


--
-- At this point, we determined the products that were in the given status
-- in the starting month. The next step is to use the current filter context
-- created by the matrix to check where those products are in the target period.
--
-- The code is very similar to the previous code, this time using StartingProductsInStatus
-- as a filter over Sales, so to restrict the analysis
--
VAR CurrentProdsAndMonths =               -- Determines the products and months
    CALCULATETABLE (                      -- in the current time period
        SUMMARIZE (
            'Sales',
            'Product'[ProductKey],
            'Date'[Calendar Year Month]
        ),                                 -- Restricting the products visible to the ones
        StartingProductsInStatus           -- determined in the previous steps
    )
VAR CurrentProdAndStatus =
    CALCULATETABLE (               -- Here we compute the Status assigned to
        FILTER (                   -- each product, for each month in the current period
            CurrentProdsAndMonths,
            [Status] IN CurrentRatings
        ),
        REMOVEFILTERS ( 'Date' )
    )
VAR CurrentProducts =                  -- We want to count products, therefore we remove
    DISTINCT (                         -- all other columns and only keep the unique
        SELECTCOLUMNS (                -- values in ProductKey
            CurrentProdAndStatus,
            "ProductKey", 'Product'[ProductKey]
        )
    )
VAR Result =
    COUNTROWS ( CurrentProducts )
RETURN
    Result
As you see, this code is not trivial at all. Changing it to make it fit your specific needs requires a deep understanding of its inner workings.
The dynamic transition matrix, albeit very powerful, is extremely demanding on CPU and RAM. Its speed mainly depends on the number of products. In data models with hundreds of thousands of products, it is unlikely to be usable. On the other hand, on smaller models it works just fine, though the static transition matrix displays much better performance.
This pattern is included in the book DAX Patterns, Second Edition.


Video

Do you prefer a video?
This pattern is also available in video format. Take a peek at the preview, then unlock access to the full-length video on SQLBI.com.Watch the full video — 37 min.
Downloads
Download the sample files for Power BI / Excel 2016-2019: