Currency conversion

Currency conversion is a complex scenario where both the data model and the quality of the DAX code play an important role. There are two kinds of currencies: the currency used to collect orders and the currency used to produce the report. Indeed, you might collect orders in multiple currencies, but need to report on those orders using only one currency, so to be able to compare all the values with the same unit of measure. Alternatively, you might collect (or store) orders in a single currency, but need to report the values using different currencies. Finally, you might have both orders that are collected in different currencies and reports that need to show many different currencies.
In this pattern, we cover three different scenarios where we simplified the description by only using EUR and USD:
- Multiple sources, single target: orders are in both EUR and USD, but the report must convert all currencies into USD.
- Single source, multiple targets: orders are only in USD, but the user can choose to see the report in either EUR or USD.
- Multiple sources, multiple targets: orders are in both EUR and USD, but the user can choose to see the report in either EUR or USD.
The formulas depend on the currency conversion table available. The requirement is often to perform the currency conversion for each day of the year. Sometimes it is only possible to perform the currency conversion at a different granularity, for example at the month level. The differences in managing these different cases are minimal, and we highlight them when showing the DAX code.
For demo purposes, we created models with both the daily and the monthly currency conversions. Therefore, you find both formulas and models in the same demo file, though you should only use one of the two exchange rate granularities for a specific implementation.
We created the daily currency conversion tables by tweaking the data available in Contoso. Therefore, these examples contain imaginary currency conversion rates with the sole purpose of showing a technique – and no guarantee of accuracy at all.
Multiple source currencies, single reporting currency
In this scenario, the source data contains orders in different currencies, and the report converts values into a single currency. For example, orders are in EUR, USD, and other currencies; the report must convert the order currency to USD.
The first thing to analyze is the model shown in Figure 1.
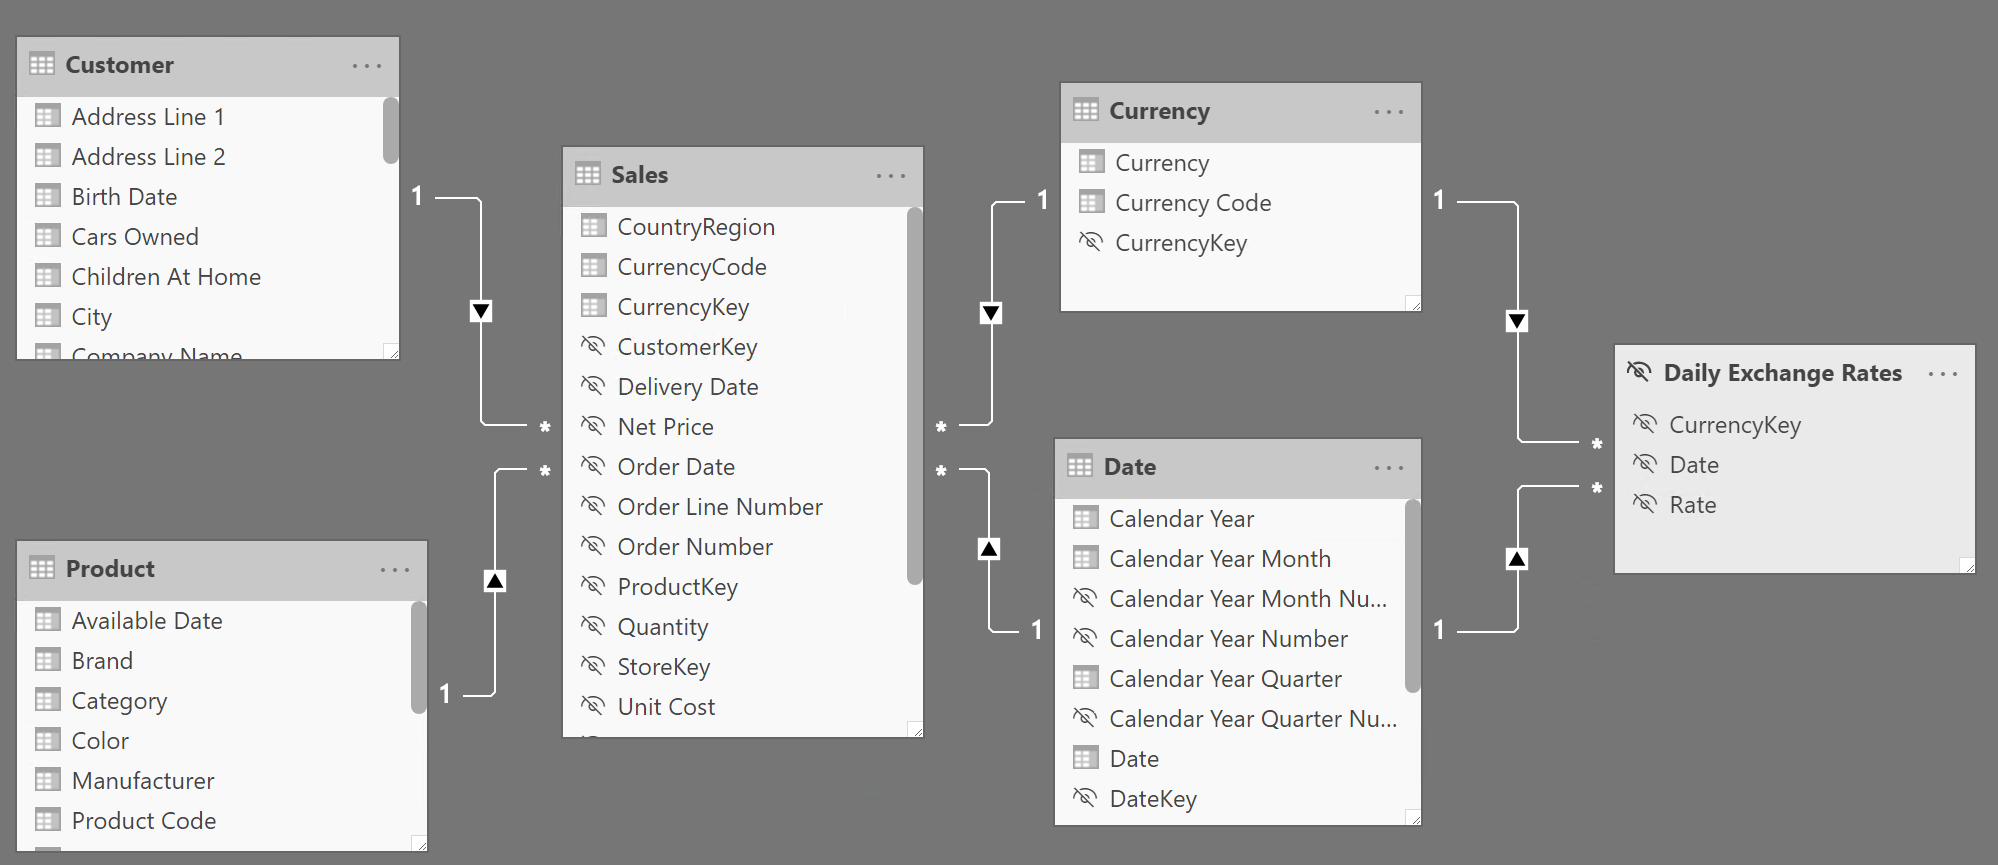
The Sales table stores the transaction value with the local currency. Every column that contains a monetary amount uses the local currency, like Net Price, Unit Price, and Unit Discount. The Sales table has a relationship with the Currency table that depends on the currency of the transaction.
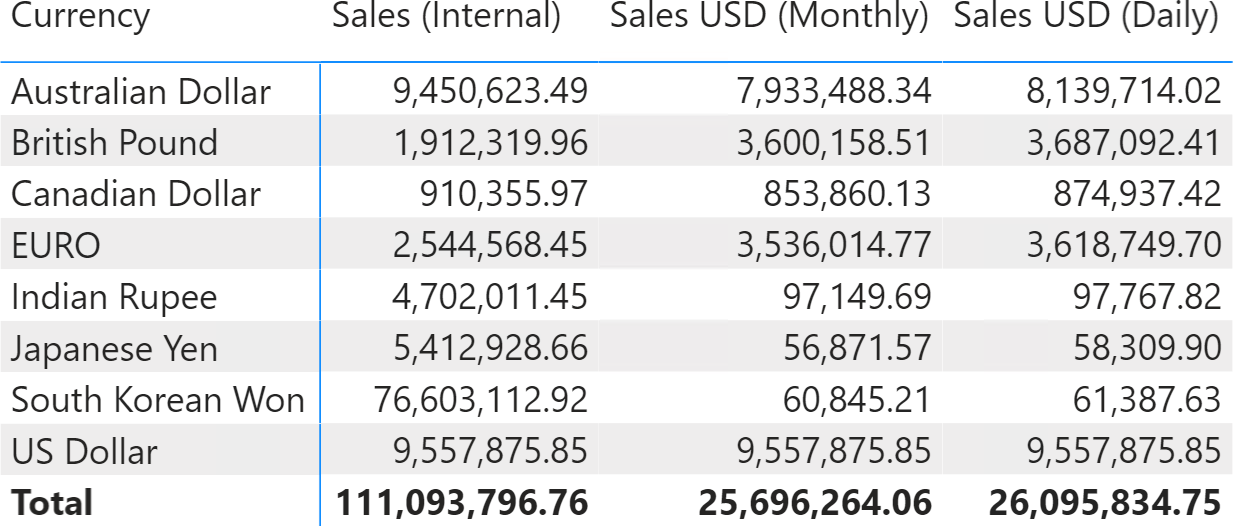
A simple measure computing the sales amount would only work if sliced by the source currency; indeed, it is not possible to aggregate values in different currencies without performing a currency conversion first. For this reason, we called the measure doing this calculation Sales (Internal), and we also hide this measure from the user:
Sales (Internal) := SUMX ( Sales, Sales[Quantity] * Sales[Net Price] )
As shown in Figure 2, Sales (Internal) produces a meaningless total, because it is summing values in different source currencies. Instead, the two measures Sales USD (Monthly) and Sales USD (Daily) produce a result that make sense, because they convert the Sales (Internal) value to USD. The differences in the report between the Sales USD (Monthly) and Sales USD (Daily) measures are due to the fluctuation of the currency exchange rates within each month.
To perform an efficient currency conversion, we aggregate Sales (Internal) at the granularity of the exchange rate for each currency, and then we apply the conversion rate. For example, the Sales USD (Daily) measure implements the calculation at a day granularity by iterating with a SUMX the result of a table that has one row for each date and currency:
Sales USD (Daily) :=
VAR AggregatedSalesInCurrency =
    ADDCOLUMNS (
        SUMMARIZE (
            Sales,
            'Date'[Date],                 -- Day granularity
            'Currency'[Currency]
        ),
        "@SalesAmountInCurrency", [Sales (Internal)],
        "@Rate", CALCULATE (
            SELECTEDVALUE ( 'Daily Exchange Rates'[Rate] )
        )
    )
VAR Result =
    SUMX (
        AggregatedSalesInCurrency,
        [@SalesAmountInCurrency] / [@Rate]
    )
RETURN
    Result
To achieve optimal performance, it is essential to reduce the number of iterations to retrieve the currency exchange rate. Performing the currency exchange rate for every transaction would be time-consuming because all the transactions made on the same day with the same currency have the same currency exchange rate. SUMMARIZE over Sales significantly reduces the granularity of the entire formula. In case the currency exchange rates are available at the month level, the formula must reduce the granularity to the month level, like Sales USD (Monthly):
Sales USD (Monthly) :=
VAR AggregatedSalesInCurrency =
    ADDCOLUMNS (
        SUMMARIZE (
            Sales,
            'Date'[Calendar Year Month],  -- Month granularity
            'Currency'[Currency]
        ),
        "@SalesAmountInCurrency", [Sales (Internal)],
        "@Rate", CALCULATE (
            SELECTEDVALUE ( 'Monthly Exchange Rates'[Rate] )
        )
    )
VAR Result =
    SUMX (
        AggregatedSalesInCurrency,
        [@SalesAmountInCurrency] / [@Rate]
    )
RETURN
    Result
The measures used in this example do not check whether a currency exchange rate is available or not because the operation being performed is a division – which results in a division by zero error in case a rate is missing. An alternative approach is to use the conditional statement in the following examples, which controls the error message displayed if a currency exchange rate is missing. You should use either one of the two techniques that raise an error in case a rate is missing, otherwise the report would show inaccurate numbers without any warning to the user.
Single source currency, multiple reporting currencies
In this scenario, the source data contains orders in a single currency (USD in our example), and the user changes the currency to use in the report through a slicer. The report converts the original amount according to the date of the transaction and to the currency selected by the user.
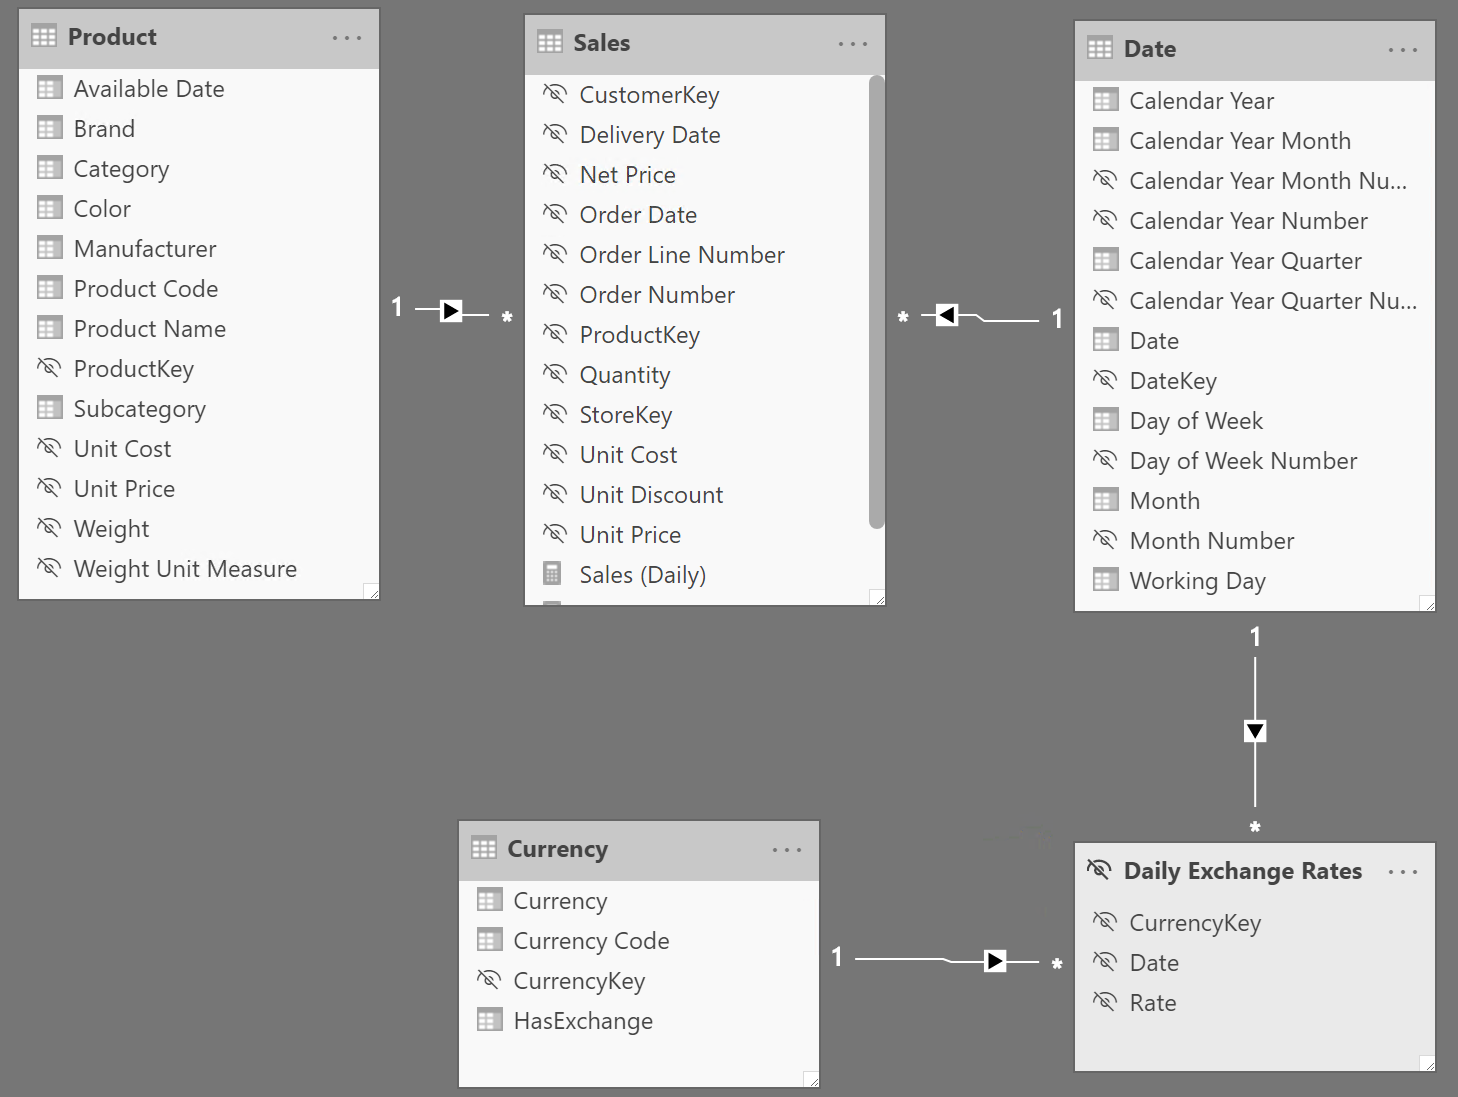
The model shown in Figure 3 does not show any direct relationship between the Sales and Currency tables. Indeed, all the sales transactions are in USD, and the Currency table allows the user to select the desired report currency.
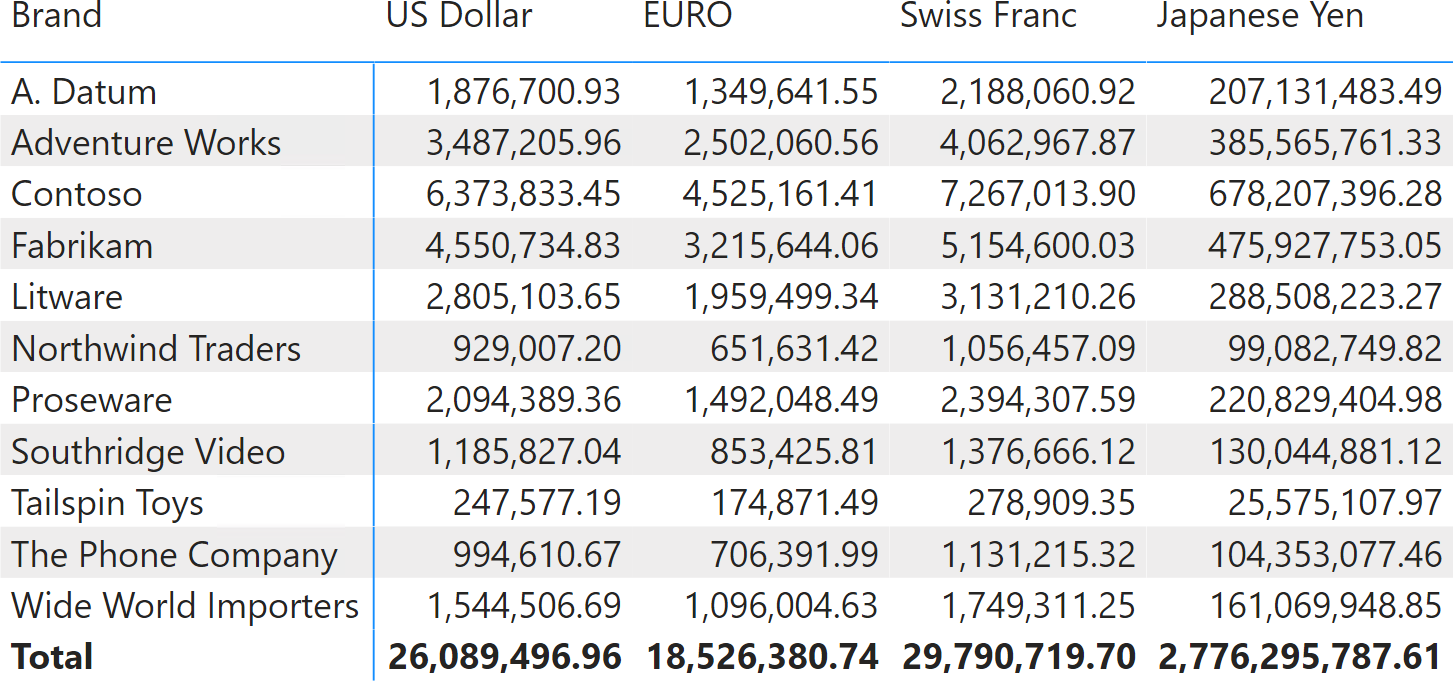
The user can either choose the desired currency with a slicer, or use the Currency[Currency] column in a matrix as shown in Figure 4, which performs the conversion using the monthly currency exchange rates.
The structure of the formula to obtain the desired result is similar to the previous example, even though its implementation is slightly different because of the data model being different. The Sales (Daily) measure applies a different currency conversion rate for every day:
Sales (Daily) :=
IF (
    HASONEVALUE ( 'Currency'[Currency] ),
    VAR AggregatedSalesInUSD =
        ADDCOLUMNS (
            SUMMARIZE (
                Sales,
                'Date'[Date]      -- Day granularity
            ),
            "@Rate", CALCULATE ( SELECTEDVALUE ( 'Daily Exchange Rates'[Rate] ) ),
            "@USDSalesAmount", [Sales (internal)]
        )
    VAR Result =
        SUMX (
            AggregatedSalesInUSD,
            IF (
                NOT ( ISBLANK ( [@Rate] ) ),
                [@USDSalesAmount] * [@Rate],
                ERROR ( "Missing conversion rate" )
            )
        )
    RETURN
        Result
)
The initial test with HASONEVALUE ensures that only one currency is visible in the current filter context. The AggregatedSalesInUSD variable stores a table with the sales amount in USD and the corresponding currency exchange rate at the day granularity. The @Rate column retrieves the proper exchange rate thanks to the existing filter over Currency[Currency] and the context transition from Date[Date] aggregated by SUMMARIZE. The Result variable gets the final result by summing the result of the product of @Rate by @USDSalesAmount, or raises an error in case @Rate is not available. This breaks the report with an error message that describes the data quality issue (Missing conversion rate).
If the currency exchange rate is only available at the month level, Sales (Monthly) only differs from Sales (Daily) by the argument of SUMMARIZE:
Sales (Monthly) :=
IF (
    HASONEVALUE ( 'Currency'[Currency] ),
    VAR AggregatedSalesInUSD =
        ADDCOLUMNS (
            SUMMARIZE (
                Sales,
                'Date'[Calendar Year Month Number]  -- Month granularity
            ),
            "@Rate", CALCULATE ( SELECTEDVALUE ( 'Monthly Exchange Rates'[Rate] ) ),
            "@USDSalesAmount", [Sales (internal)]
        )
    VAR Result =
        SUMX (
            AggregatedSalesInUSD,
            IF (
                NOT ( ISBLANK ( [@Rate] ) ),
                [@USDSalesAmount] * [@Rate],
                ERROR ( "Missing conversion rate" )
            )
        )
    RETURN
        Result
)
Multiple source currencies, multiple reporting currencies
This scenario is a combination of the previous two. The source data contains orders in different currencies, and the user changes the currency to use in the report through a slicer. The report converts the original amount according to the date of the transaction, the original currency, and the reporting currency selected by the user.
There are two currency tables in the data model: Source Currency and Target Currency. The Source Currency table has a relationship with Sales and represents the currency of the transaction. The Target Currency table allows the user to select the desired currency for the report. The model is visible in Figure 5.
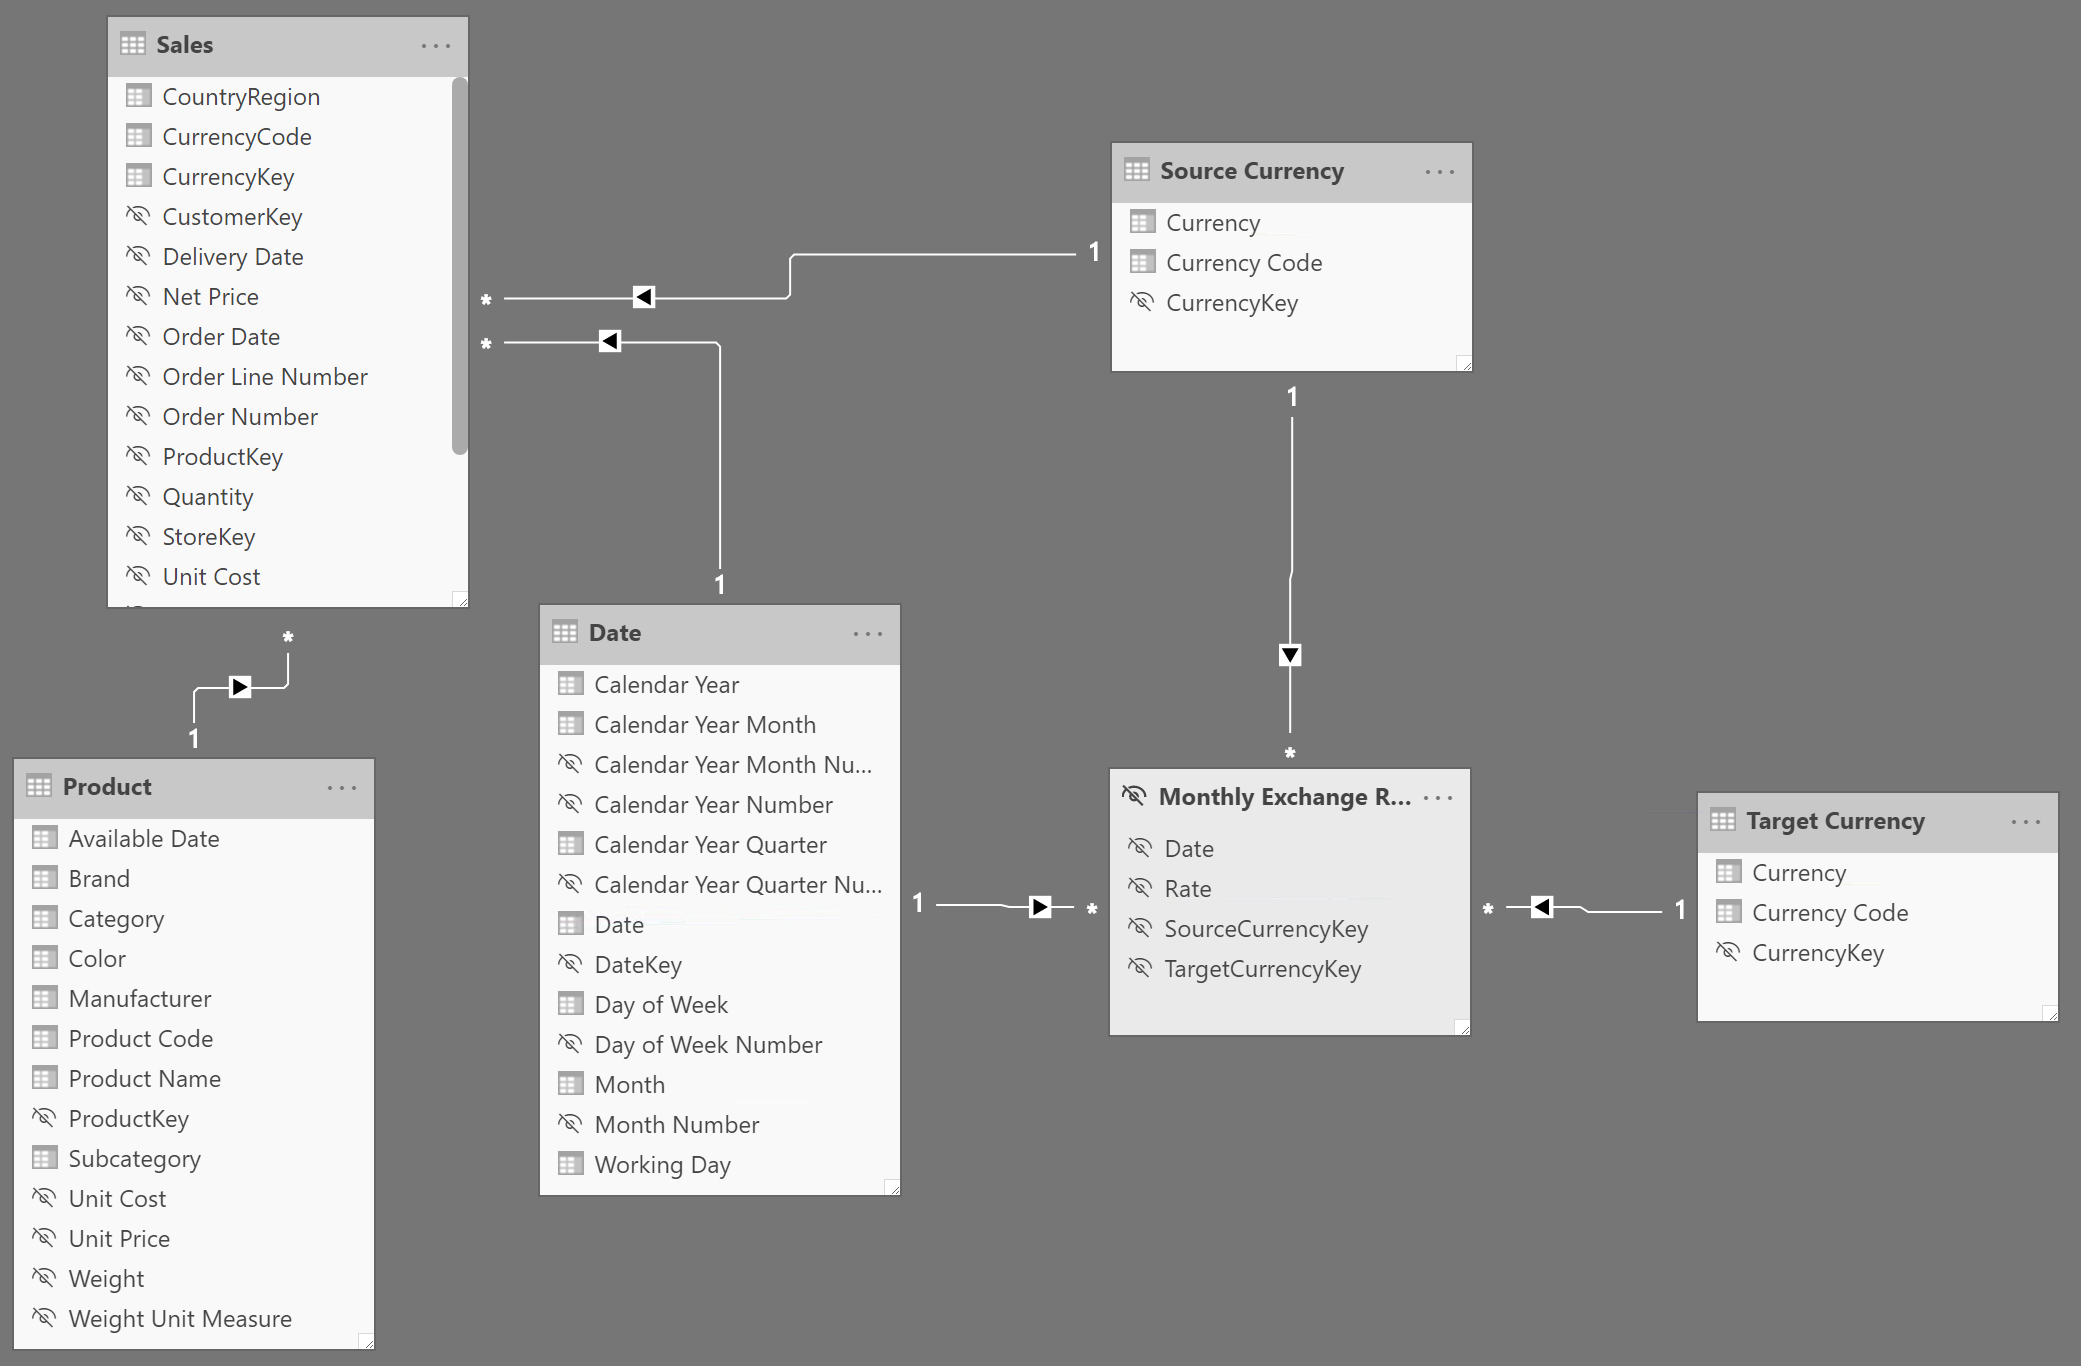
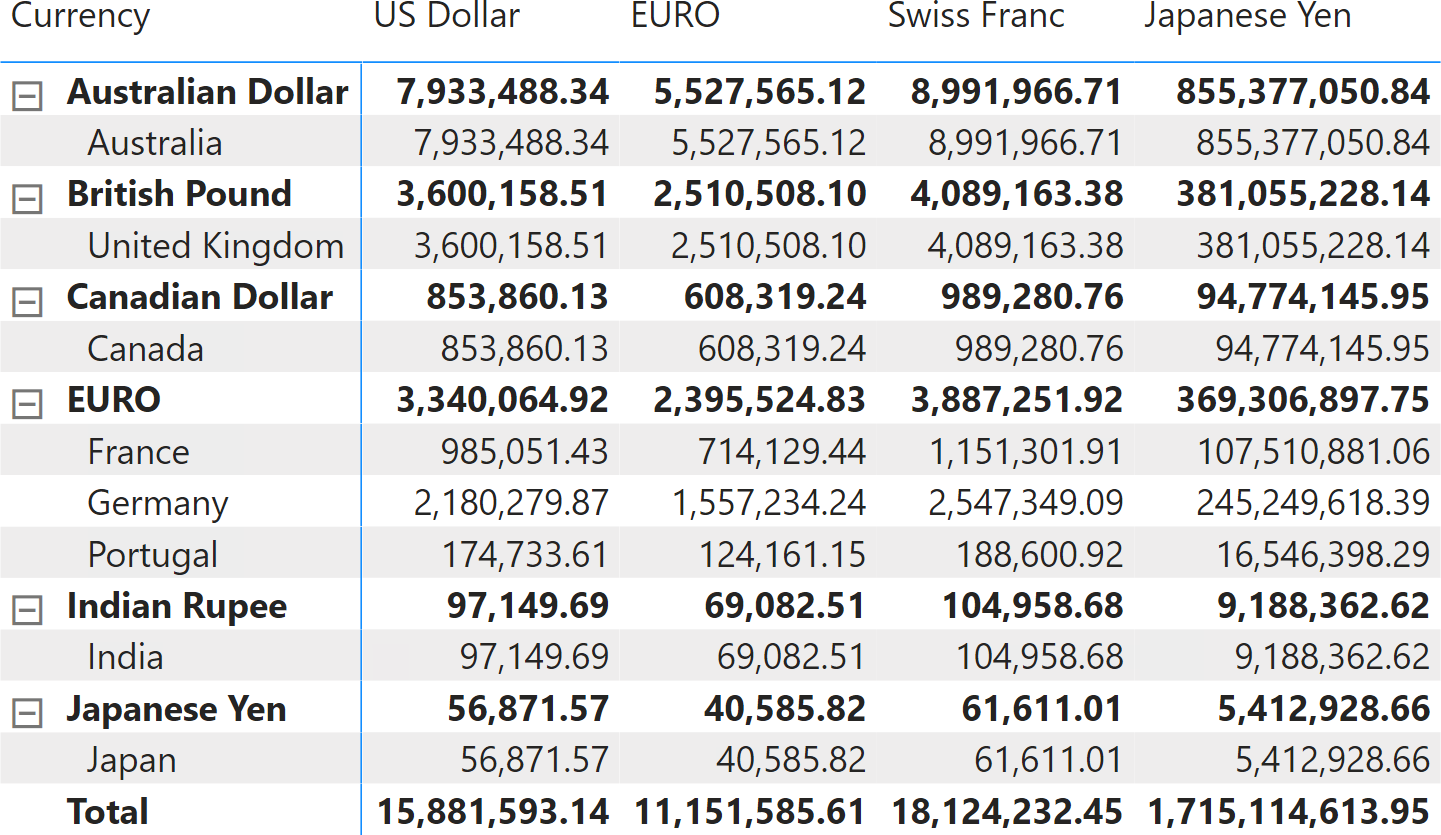
This model enables the conversion of any source currency into any target currency. Figure 6 shows orders collected in different currencies from several countries using the monthly currency exchange rates. The report converts the original amount into the currency displayed in the column of the matrix.
The formula of the measure – like the model – is a mix of the two previous ones. The HASONEVALUE function checks that only one target currency is selected. The AggregatedSalesInCurrency variable contains a table with the sales amount aggregated at the available granularity of the currency exchange rate, also including the source currency. The @Rate column fetches the proper exchange rate thanks to the existing filter over ‘Target Currency'[Currency], and thanks to the context transition from Date[Date] and ‘Source Currency'[Currency] aggregated by SUMMARIZE. The Result variable obtains the final result by summing the result of the product of @Rate by @SalesAmount, or raising an error in case @Rate is not available:
Sales (Daily) :=
IF (
    HASONEVALUE ( 'Target Currency'[Currency] ),
    VAR AggregatedSalesInCurrency =
        ADDCOLUMNS (
            SUMMARIZE (
                Sales,
                'Date'[Date],                 -- Day granularity
                'Source Currency'[Currency]
            ),
            "@SalesAmount", [Sales (Internal)],
            "@Rate", CALCULATE ( SELECTEDVALUE ( 'Daily Exchange Rates'[Rate] ) )
        )
    VAR Result =
        SUMX (
            AggregatedSalesInCurrency,
            IF (
                NOT ( ISBLANK ( [@Rate] ) ),
                [@SalesAmount] * [@Rate],
                ERROR ( "Missing conversion rate" )
            )
        )
    RETURN
        Result
)
As with the previous examples, it is important to use the granularity of the currency exchange table. If the currency exchange rate is only available at the month level, the Sales (Monthly) measure only differs from Sales (Daily) by the argument of SUMMARIZE:
Sales (Monthly) :=
IF (
    HASONEVALUE ( 'Target Currency'[Currency] ),
    VAR AggregatedSalesInCurrency =
        ADDCOLUMNS (
            SUMMARIZE (
                Sales,
                'Date'[Calendar Year Month],    -- Month granularity
                'Source Currency'[Currency]
            ),
            "@SalesAmount", [Sales (Internal)],
            "@Rate", CALCULATE ( SELECTEDVALUE ( 'Monthly Exchange Rates'[Rate] ) )
        )
    VAR Result =
        SUMX (
            AggregatedSalesInCurrency,
            IF (
                NOT ( ISBLANK ( [@Rate] ) ),
                [@SalesAmount] * [@Rate],
                ERROR ( "Missing conversion rate" )
            )
        )
    RETURN
        Result
)
Returns the sum of an expression evaluated for each row in a table.
SUMX ( <Table>, <Expression> )
Creates a summary of the input table grouped by the specified columns.
SUMMARIZE ( <Table> [, <GroupBy_ColumnName> [, [<Name>] [, [<Expression>] [, <GroupBy_ColumnName> [, [<Name>] [, [<Expression>] [, … ] ] ] ] ] ] ] )
Returns true when there’s only one value in the specified column.
HASONEVALUE ( <ColumnName> )
This pattern is included in the book DAX Patterns, Second Edition.


Video

Do you prefer a video?
This pattern is also available in video format. Take a peek at the preview, then unlock access to the full-length video on SQLBI.com.Watch the full video — 41 min.
Downloads
Download the sample files for Power BI / Excel 2016-2019: