Ranking

The ability to rank things is a very common requirement. Finding the best customers, computing the ranking position of products, or detecting the countries with the best sales volumes are among the questions most frequently asked by management.
Ranking can be either static or dynamic. Static ranking assigns to each product a ranking position that is not affected by filters, whereas in dynamic ranking the position is computed every time the user interacts with the report. For example, in dynamic ranking the year selected in the report defines a new calculation of the ranking value.
All the basic ranking calculations are based on the RANKX function, whereas more advanced techniques – like filtering the top 10 products – require the TOPN function and advanced table calculations.
Static ranking
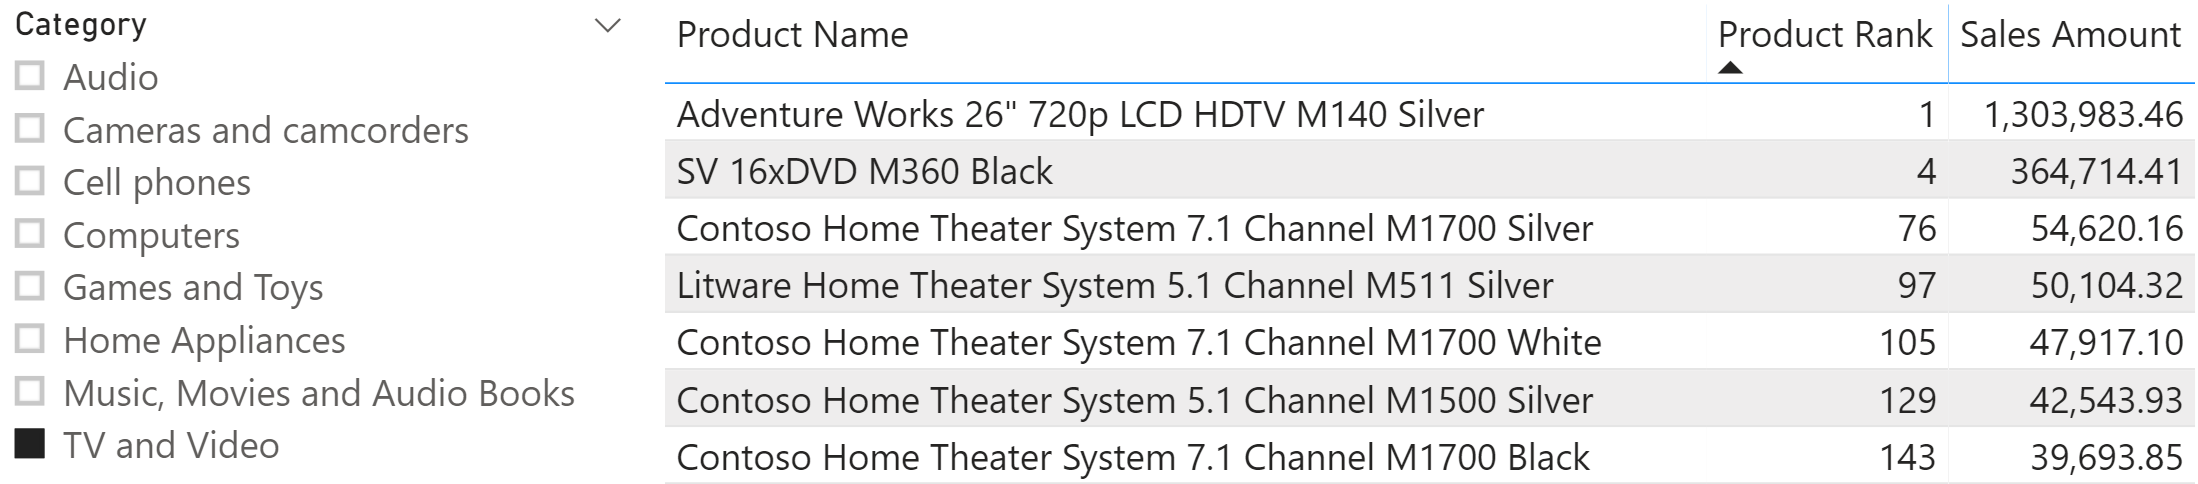
You assign a static ranking to a product by using a calculated column. The calculated column is computed during data refresh. Therefore, the value of the static ranking does not depend on the report filters. For example, in Figure 1 the first product is ranked 1 because the LCD HDTV M140 is the top seller among products of any category, whereas the second product (SV 16xDVD M360 Black) shows a product rank equal to 4 instead of 2. The reason is that there are another two products ranked 2 and 3 that are not included in the TV and Video category, which is selected in the Category slicer. Nevertheless, the ranking being static does not consider report filters. It shows the overall ranking of the products visible in the report.
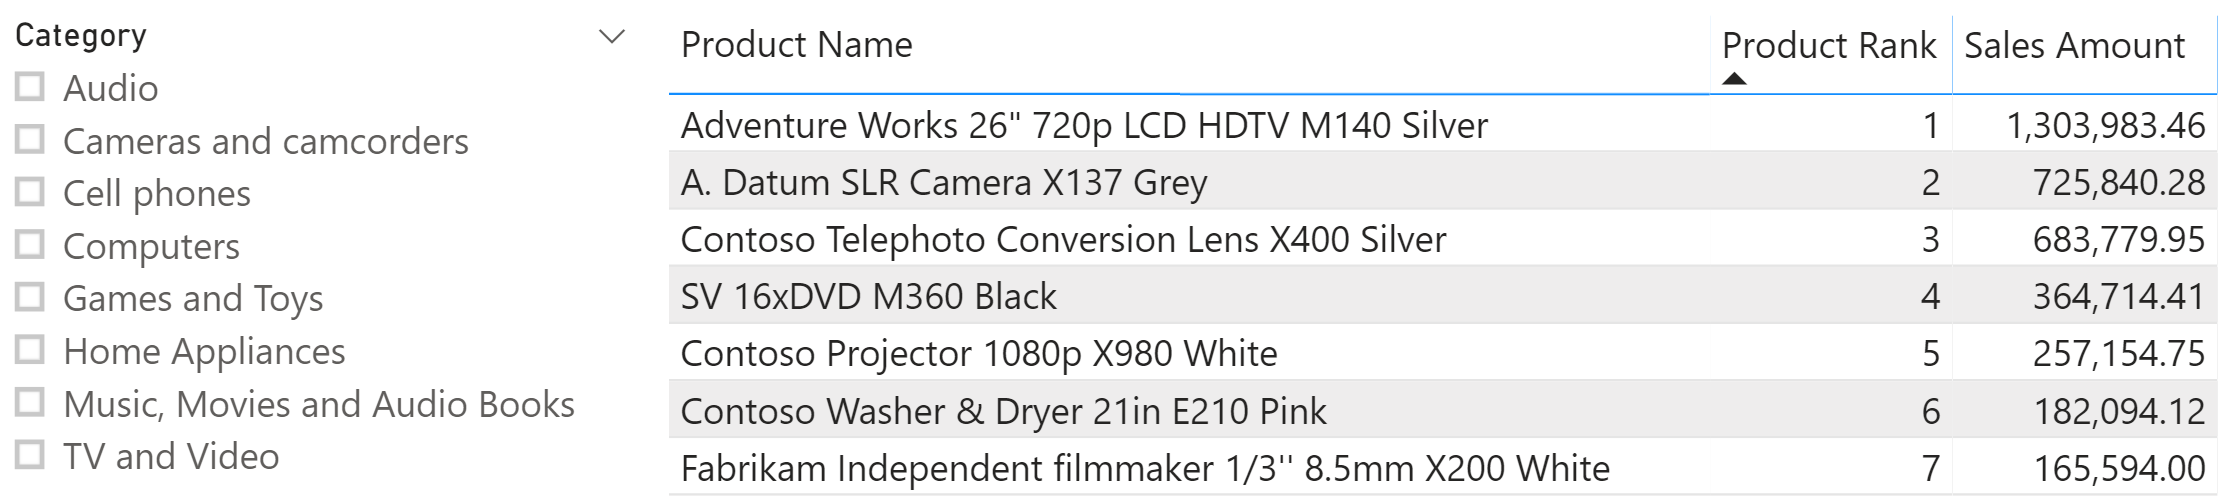
Removing the filter on Category, the overall ranking shows all the products as one would expect. This is shown in the following figure.
To compute the static ranking of a product based on the Sales Amount measure we need a calculated column in the Product table:
Product Rank =
RANKX (
    ALL ( 'Product' ),
    [Sales Amount]
)
In this code, the ALL function is not needed. However, it clarifies the intention of ranking against all the products which is why we added it; it makes the code easier to read over time.
A similar formula can be used to obtain the ranking over a subset of products. For example, the following calculated column computes the ranking of a product inside its category:
Rank in Category =
RANKX (
    ALLEXCEPT ( 'Product', 'Product'[Category] ),
    [Sales Amount]
)
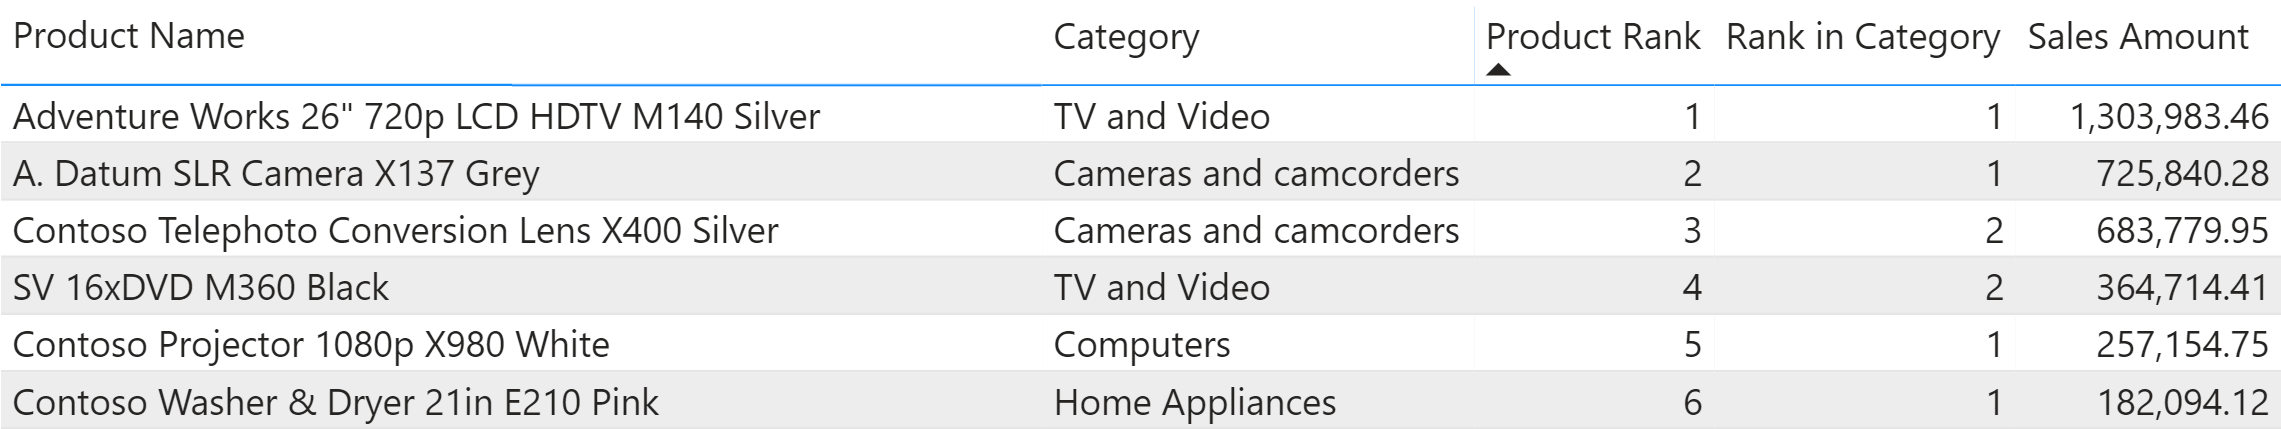
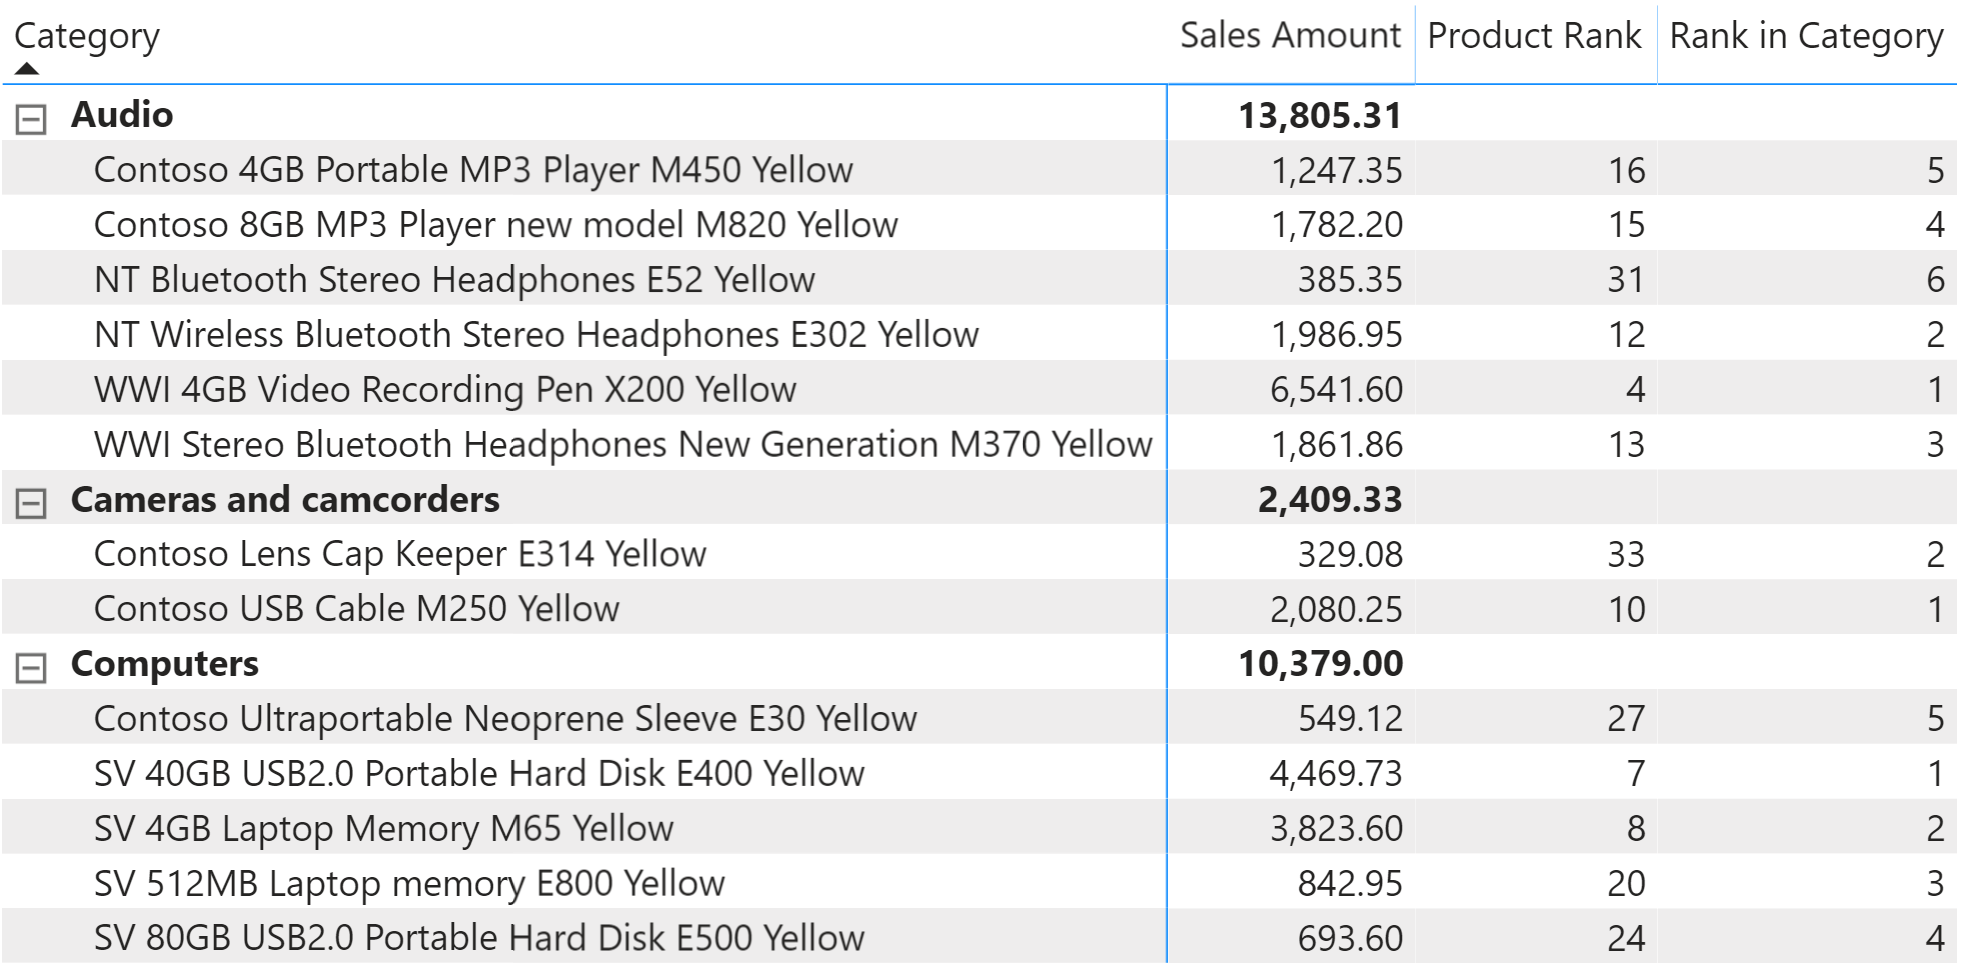
As shown in the figure below, the fourth row (SV 16xDVD M360 Black) has a Product Rank of 4 and a Rank in Category of 2, because the latter is the ranking in the TV and Video category.
Dynamic ranking
The dynamic ranking pattern produces a ranking that changes depending on the report filters. Consequently, it is based on measures instead of calculated columns.
The code of the Product Rank measure is the following:
Product Rank :=
IF (
    ISINSCOPE ( 'Product'[Product Name] ),
    VAR SalesAmountCurrentProduct = [Sales Amount]
    VAR ProductRank =
        RANKX (
            ALLSELECTED ( 'Product' ),
            [Sales Amount]
        )
    VAR Result =
        IF (
            NOT ISBLANK ( SalesAmountCurrentProduct ),
            ProductRank
        )
    RETURN
        Result
)
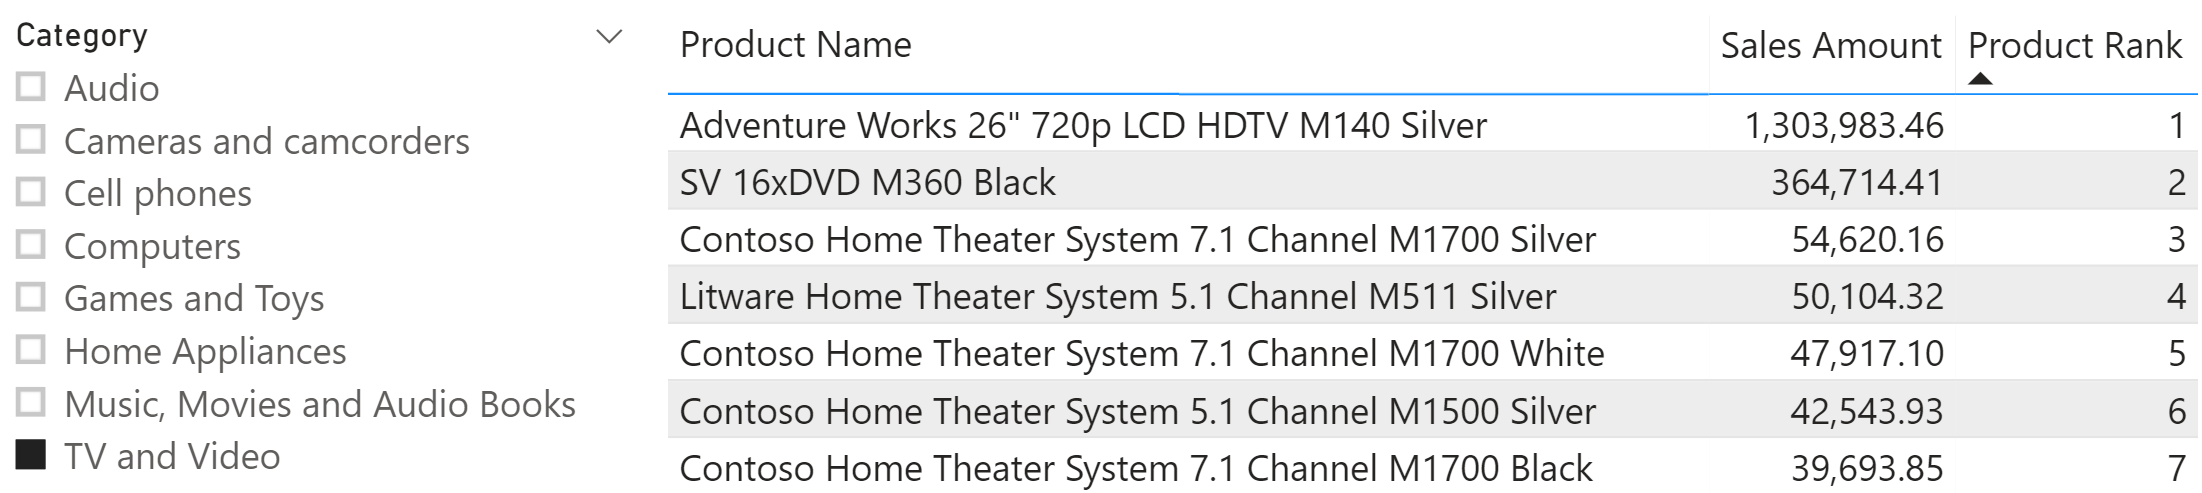
Obtaining different rankings requires modifying the table iterated by RANKX. For example, the following figure shows a Rank in Category measure that returns the ranking of a product between the products of the same category, still considering any other filter existing in the report, if any.
The definition of the Rank in Category measure is the following:
Rank in Category :=
VAR SalesAmountCurrentProduct = [Sales Amount]
VAR ProductsInCategory =
    CALCULATETABLE (
        'Product',
        REMOVEFILTERS ( 'Product'[Product Name] ),
        ALLSELECTED ( 'Product' ),
        VALUES ( 'Product'[Category] )
    )
VAR ProductRank =
    IF (
        ISINSCOPE ( 'Product'[Product Name] ),
        RANKX (
            ProductsInCategory,
            [Sales Amount]
        )
    )
VAR Result =
    IF (
        NOT ISBLANK ( SalesAmountCurrentProduct ),
        ProductRank
    )
RETURN
    Result
Showing the top 3 products by category
Ranking is useful to obtain reports that filter products based on their local ranking in a given group. For example, the report below shows how to obtain the top three products for each category. There are two possible solutions to this scenario, depending on whether the product name is part of the report or not.
If the report contains the product name, then we can use the Rank in Category measure of the dynamic pattern and rely on Power BI visual filters.
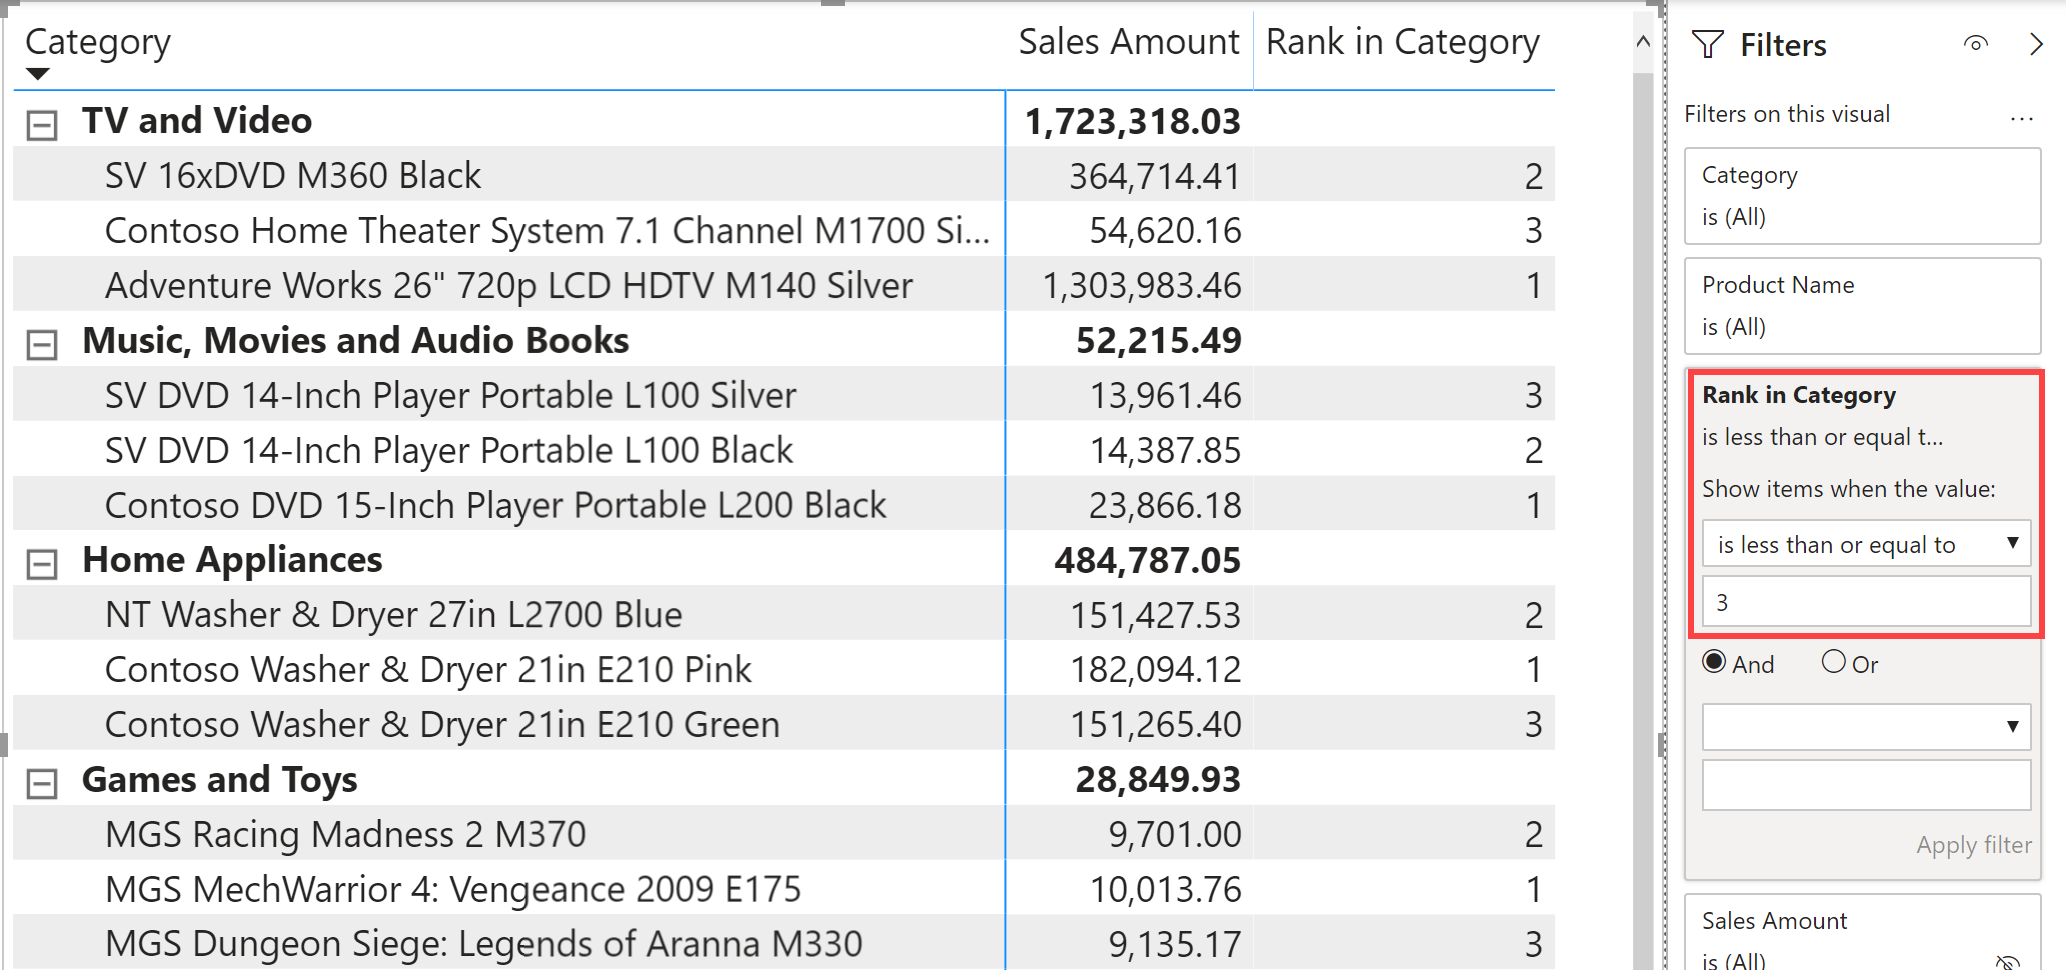
Although this technique is not the most powerful, we show it because it is a very efficient way of filtering the top three products. Besides, it also solves the most common requirement which is to actually show by name the products included in the top three.
Nevertheless, if the product name is not part of the visual, then this technique cannot be used. The reason is that the granularity of the visual is not compatible with the measure and the previous technique no longer works. In the figure below, we removed the product names from the report above.
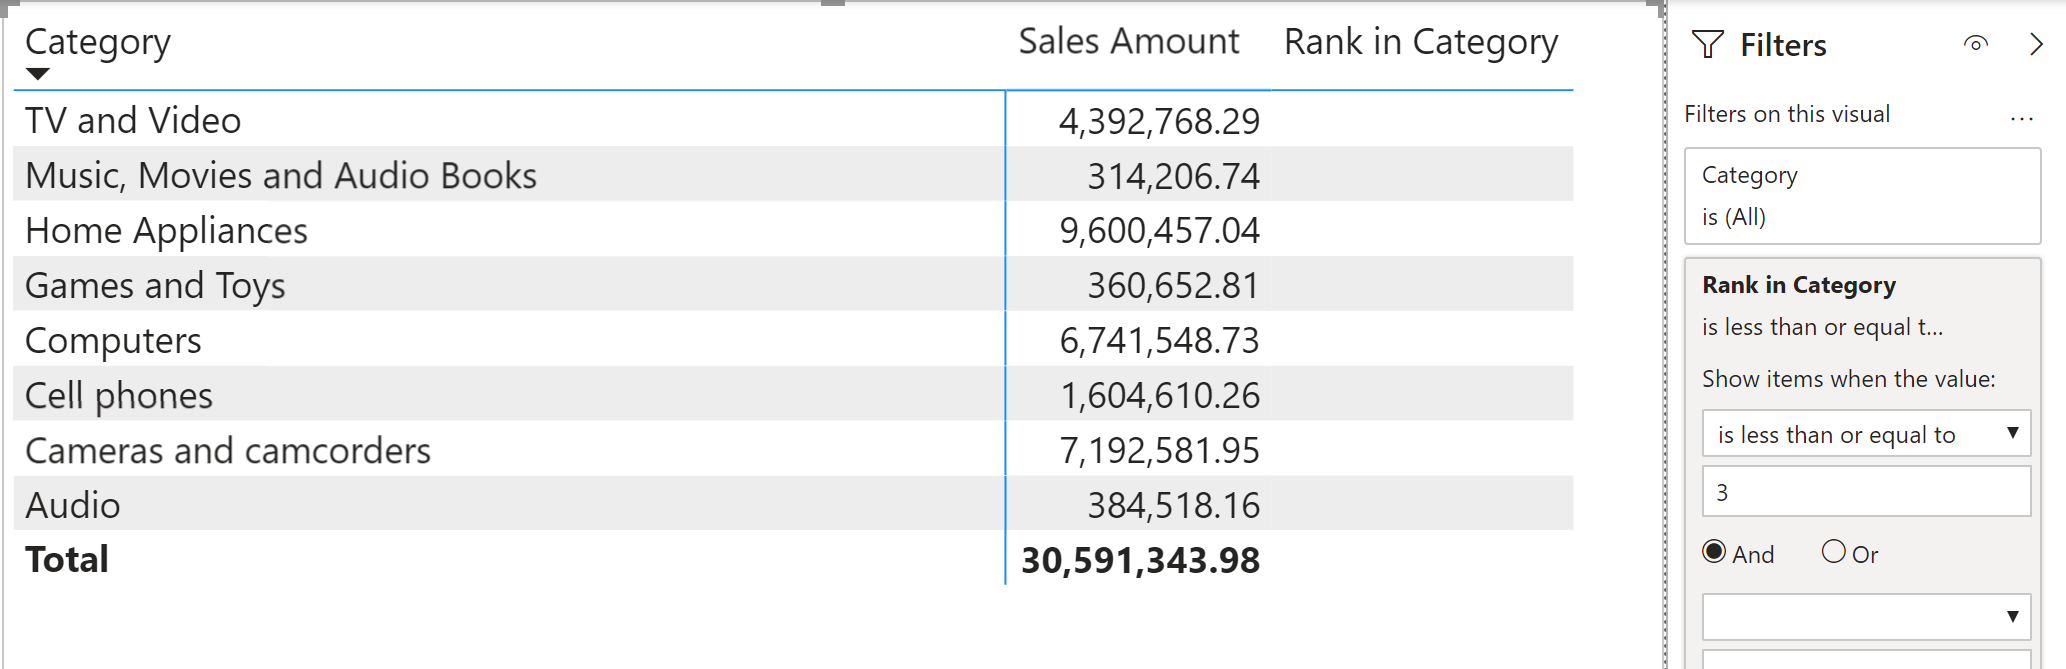
The reason the visual filter is not effective is because it is only applied to the maximum granularity of the visual. Therefore, the visual filter does not necessarily apply to the products. In order to enforce the filter over product names, the measure displaying Sales Amount must enforce the computation of the ranking at the correct granularity, determining the products to be included in the calculation and then using those products as a filter. The report must display the amount using the following definition of Sales Top 3 Products:
Sales Top 3 Products :=
VAR TopThreeProducts =
    GENERATE (
        ALLSELECTED ( 'Product'[Category] ),         -- For each category
        TOPN (                                       -- retrieve the top
            3,                                       -- three product
            ALLSELECTED ( 'Product'[Product Name] ), -- names based on the
            [Sales Amount]                           -- sales amount
        )
    )
VAR Result =
    CALCULATE (
        [Sales Amount],                      -- Compute sales amount
        KEEPFILTERS ( TopThreeProducts )     -- using TopThreeProducts as a
    )                                        -- further filter
RETURN
    Result
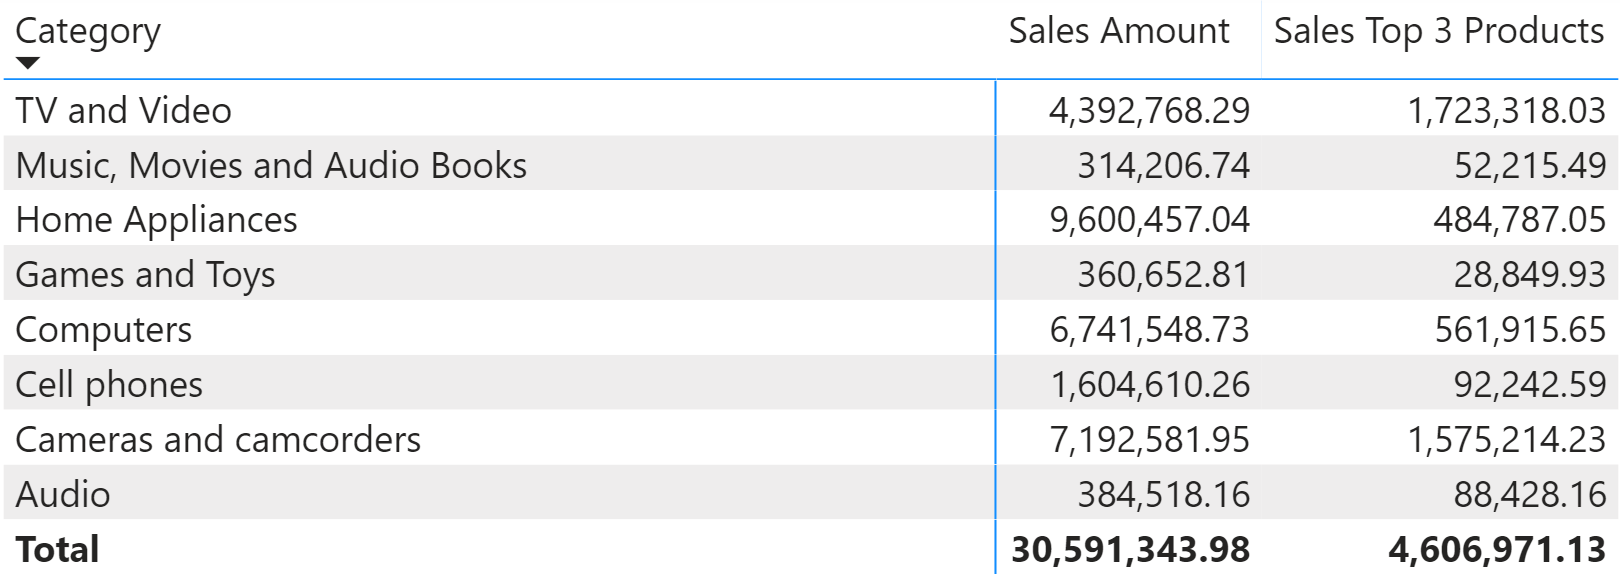
The following figure shows the result of Sales Top 3 Products side by side with Sales Amount. Though the product name is not part of the report, the formula for Sales Top 3 Products retrieves sales strictly for the top three products of each category, ignoring all other products. This also applies to the grand total of the report.
Performance-wise, the formula used for Sales Top 3 Products is slightly slower than the one using the visual-level filter. Therefore, we suggest implementing the first solution, if feasible, and reverting to the full pattern only if strictly necessary or if the client tool does not support visual-level filters.
Returns the rank of an expression evaluated in the current context in the list of values for the expression evaluated for each row in the specified table.
RANKX ( <Table>, <Expression> [, <Value>] [, <Order>] [, <Ties>] )
Returns a given number of top rows according to a specified expression.
TOPN ( <N_Value>, <Table> [, <OrderBy_Expression> [, [<Order>] [, <OrderBy_Expression> [, [<Order>] [, … ] ] ] ] ] )
Returns all the rows in a table, or all the values in a column, ignoring any filters that might have been applied.
ALL ( [<TableNameOrColumnName>] [, <ColumnName> [, <ColumnName> [, … ] ] ] )
This pattern is included in the book DAX Patterns, Second Edition.


Video

Do you prefer a video?
This pattern is also available in video format. Take a peek at the preview, then unlock access to the full-length video on SQLBI.com.Watch the full video — 33 min.
Downloads
Download the sample files for Power BI / Excel 2016-2019: