Static segmentation

The static segmentation pattern classifies numerical values into ranges. A typical example is the analysis of sales by price range. You do not want to slice the data by individual price; instead you want to simplify the analysis by grouping prices within ranges of prices. The price ranges are stored in a configuration table and the pattern requires the model to be entirely data-driven. In other words, when the configuration table is updated, the model is updated automatically without requiring any change to the DAX code.
Depending on the size of the data model, there are different options for this pattern. On small models (up to a few million rows) the best option is to use calculated columns and/or calculated relationships. On larger models with hundreds of millions of rows, calculated columns might increase the processing time of the model. Therefore, for large models the best option is to build a calculated table expanding the prices, thereby reducing to a minimum the number of calculated columns in the larger tables.
Basic pattern
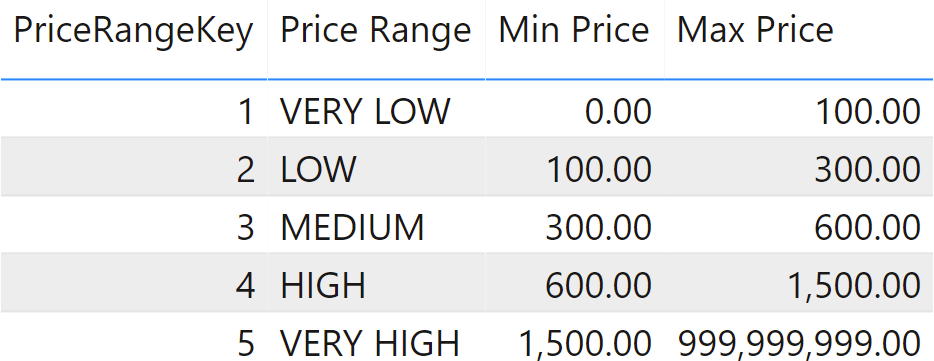
You need to analyze sales sliced by price range. To attain this goal, you build a configuration table that stores the price ranges; the price should be greater than or equal to the Min Price and less than the Max Price, as shown in Figure 1.
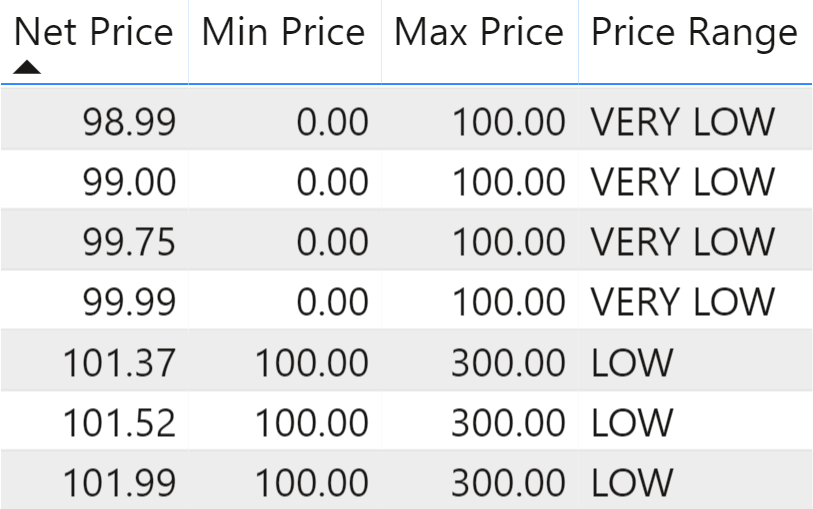
Then, you want to analyze sales by price range, obtaining a report like Figure 2.
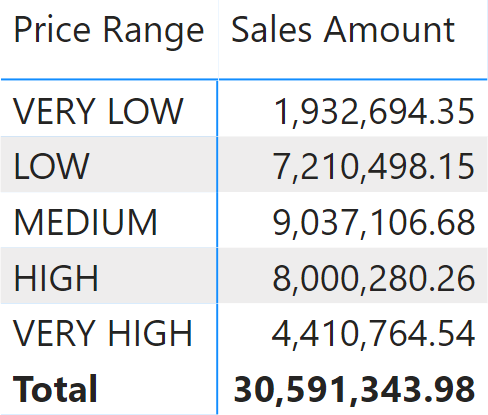
In the report, the VERY LOW row contains the sales with a net price between 0 and 100.
In order to obtain the desired result, you need a relationship between the configuration table (Price Ranges) and the Sales table. In the example, we use Sales[Net Price] instead of Sales[Unit Price] to determine the sales price, so to consider possible discounts. Indeed, Sales[Net Price] might be different than Sales[Unit price] because of discounts. The required relationship should use a “between” condition for the join, which is not natively supported by the Tabular engine. Nevertheless, in the Sales table we can add a calculated column that stores the key of the price range for each specific row, by using the following code:
PriceRangeKey =
VAR CurrentPrice = Sales[Net Price]
VAR FilterSegment =
    FILTER (
        'Price Ranges',
        AND (
            'Price Ranges'[Min Price] < CurrentPrice,
            'Price Ranges'[Max Price] >= CurrentPrice
        )
    )
VAR Result =
    CALCULATE (
        DISTINCT ( 'Price Ranges'[PriceRangeKey] ),
        FilterSegment
    )
RETURN
    Result
When building the calculated column, you need to be careful not to use functions that might reference the blank row, such as ALL and VALUES. This is the reason we used DISTINCT instead of VALUES to retrieve the price range key.
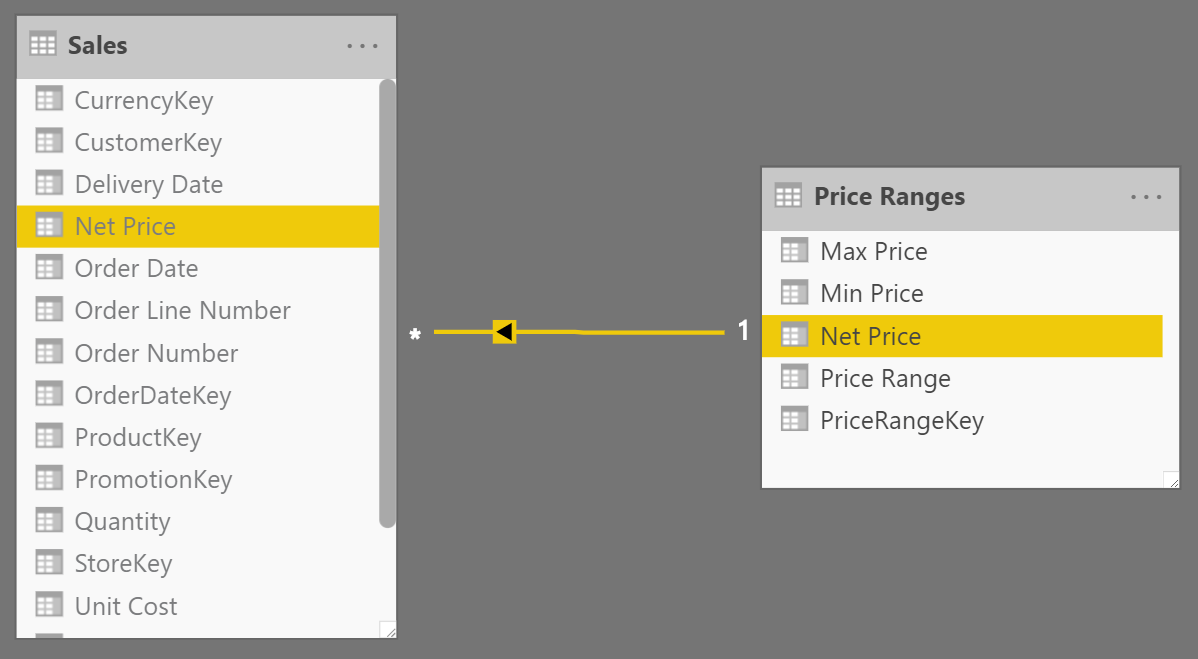
Next, you build a relationship between Sales and Price Ranges based on the new calculated column, like in Figure 3.
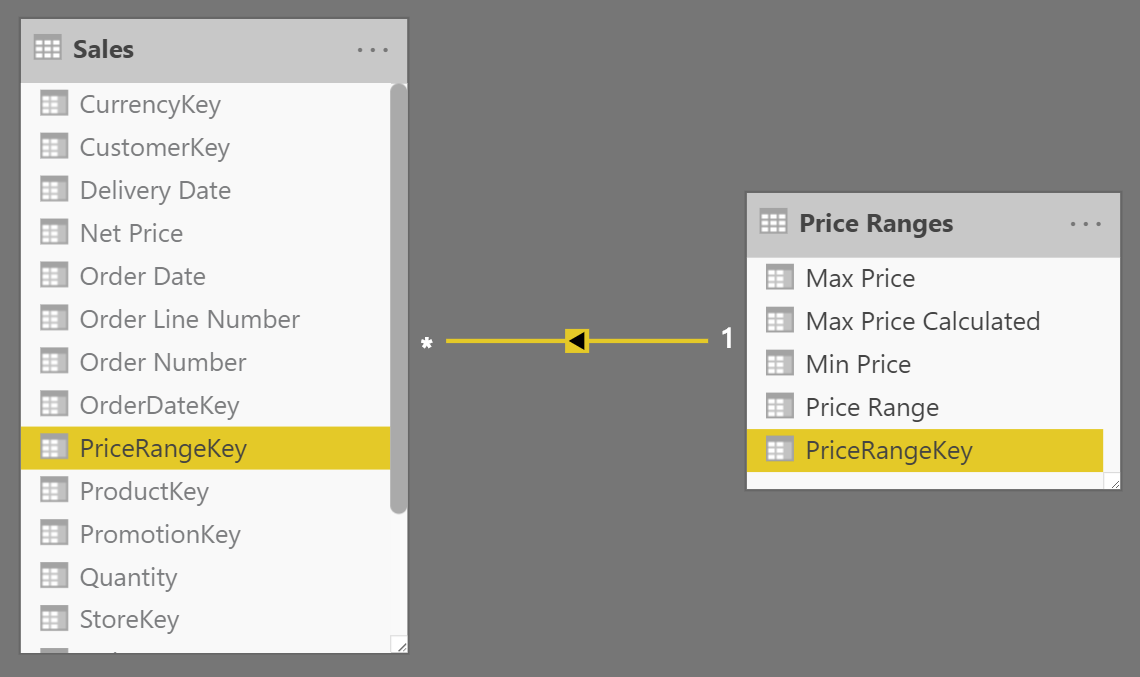
Once the relationship is in place, you can slice sales by ‘Price Ranges'[Price Range].
You need to make sure that the configuration table is properly designed, so that each price belongs to only one price range. The presence of overlapping segments in the configuration table can generate errors in the evaluation of the PriceRangeKey calculated column. If you want to make sure there are no mistakes in the configuration table – such as overlapping ranges – you can generate the Max Price column using a calculated column that retrieves the value of Min Price for the next segment. This is shown in the following sample code.
Max Price Calculated =
VAR CurrentMinPrice = 'Price Ranges'[Min Price]
VAR NextMinPrice =
    CALCULATE (
        MIN ( 'Price Ranges'[Min Price] ),
        REMOVEFILTERS ( 'Price Ranges' ),
        'Price Ranges'[Min Price] > CurrentMinPrice
    )
VAR MaxPrice =
    IF ( ISBLANK ( NextMinPrice ), 999999999, NextMinPrice )
RETURN
    MaxPrice
You can also write a safer version of the calculated column that writes a blank or generates an error in the event there are multiple ranges active for one price, as in the following example:
PriceRangeKey =
VAR CurrentPrice = Sales[Net Price]
VAR FilterSegment =
    FILTER (
        'Price Ranges',
        AND (
            'Price Ranges'[Min Price] < CurrentPrice,
            'Price Ranges'[Max Price] >= CurrentPrice
        )
    )
VAR FilteredPriceRangeKey =
    CALCULATETABLE (
        DISTINCT ( 'Price Ranges'[PriceRangeKey] ),
        FilterSegment
    )
VAR Result =
    IF (
        COUNTROWS ( FilteredPriceRangeKey ) = 1,
        FilteredPriceRangeKey,
        -- The next line raises a more specific error in the calculated column.
        -- You can replace ERROR with BLANK() in order to just ignore the prices
        -- matching multiple segments, but bear in mind that doing it this way
        -- you would hide possible errors in the report.
        ERROR ( "Overlapping ranges in Price Ranges table" )
    )
RETURN
    Result
The code shown in this pattern must satisfy the requirements for calculated columns used in a relationship, in order to avoid circular dependencies.
Price ranges by category
A variation of the static segmentation pattern is when the condition to check is not a simple between, but rather a more complex condition. For example, the requirement might be to use different price ranges for different product categories: The LOW price range for games and toys needs to be different from the LOW price range for home appliances.
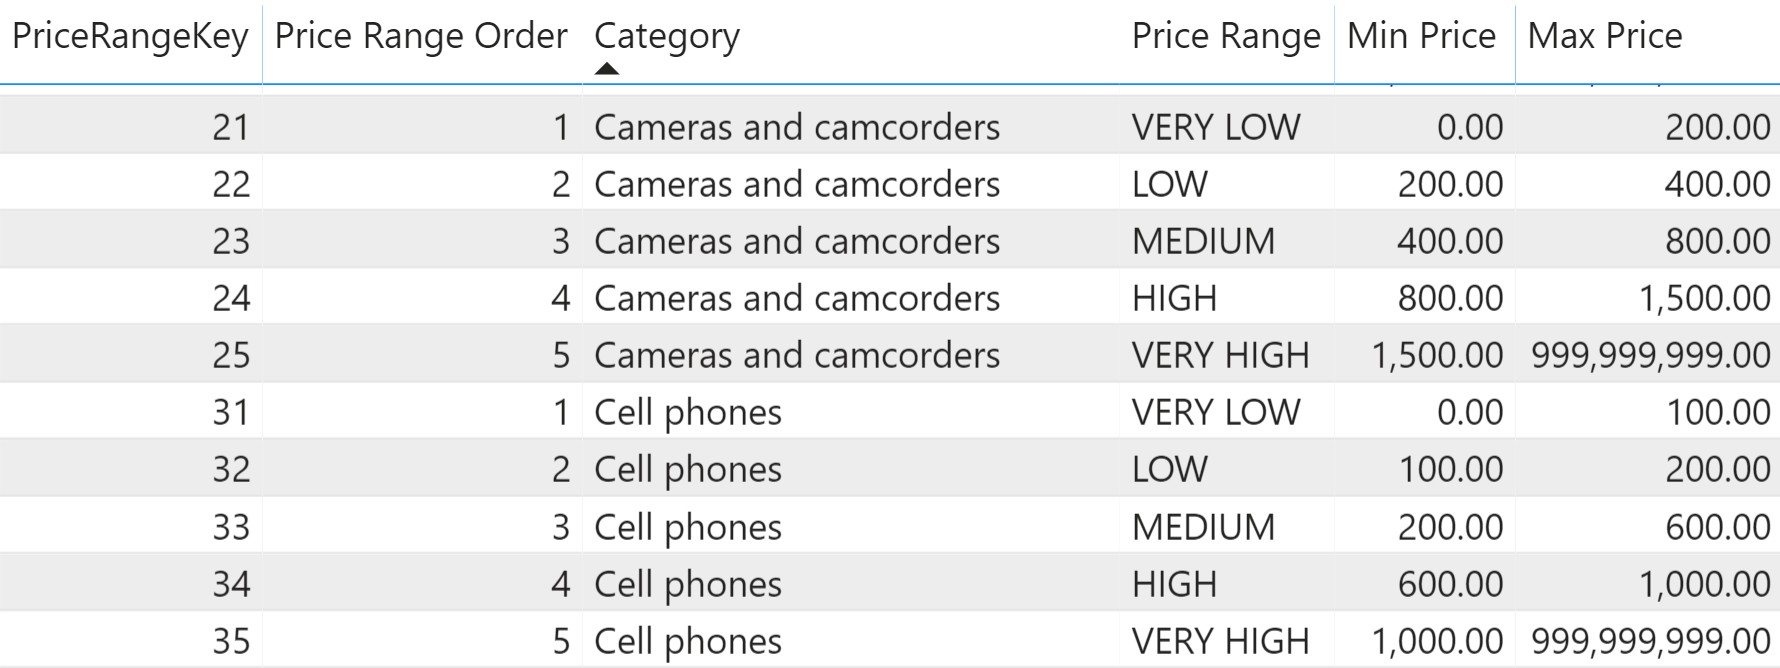
In this scenario, the configuration table contains an additional column that indicates the category the price range must be applied to. Different categories might have different price ranges, as in Figure 4.
The pattern here is very similar to the basic pattern, the only noticeable change being in the condition used to find the correct price range key. Indeed, the search must be limited to the row in the Price Ranges table with the category of the product being sold and where the net price falls within the desired range:
PriceRangeKey =
VAR CurrentPrice = Sales[Net Price]
VAR CurrentCategory = RELATED ( 'Product'[Category] )
VAR FilterSegment =
    FILTER (
        'Price Ranges',
        'Price Ranges'[Category] = CurrentCategory
            && 'Price Ranges'[Min Price] < CurrentPrice
            && 'Price Ranges'[Max Price] >= CurrentPrice
    )
VAR FilteredPriceRangeKey =
    CALCULATETABLE (
        DISTINCT ( 'Price Ranges'[PriceRangeKey] ),
        FilterSegment
    )
VAR Result =
    IF (
        COUNTROWS ( FilteredPriceRangeKey ) = 1,
        FilteredPriceRangeKey,
        ERROR ( "Overlapping ranges in Price Ranges table" )
    )
RETURN
    Result
Similarly, you can use any other condition if it is guaranteed that only one row remains visible in the configuration table. In order to make sure that the configuration table does not contain overlapping ranges, you can generate the Max Price column using a calculated column similar to the one used in the basic pattern. The important difference is the use of ALLEXCEPT instead of REMOVEFILTERS, so that the filter over ‘Price Ranges'[Category] coming from the context transition is kept in the filter context:
Max Price Calculated =
VAR CurrentMinPrice = 'Price Ranges'[Min Price]
VAR NextMinPrice =
    CALCULATE (
        MIN ( 'Price Ranges'[Min Price] ),
        -- ALLEXCEPT is required to filter only the other
        -- segments of the same category
        ALLEXCEPT ( 'Price Ranges', 'Price Ranges'[Category] ),
        'Price Ranges'[Min Price] > CurrentMinPrice
    )
VAR MaxPrice =
    IF ( ISBLANK ( NextMinPrice ), 999999999, NextMinPrice )
RETURN
    MaxPrice
Price ranges on large tables
The static segmentation pattern requires the creation of a calculated column in the Sales table. The column itself is typically rather small in size, because it contains few distinct values. However, on very large tables the column size might start to grow and you may face another problem: the column needs to be computed for the entire table at every data refresh. On a multi-billion-row table that is likely to be partitioned, the column needs to be recomputed for the entire table whenever one partition is refreshed. This slows down every refresh operation.
In this scenario, it is possible to use a variation of the static segmentation that works without adding any column in the Sales table. Instead of building the relationship with the new calculated column, this pattern uses Sales[Net Price] as the key for a relationship with a new calculated table. Indeed, it is not possible to create a relationship between Sales and the Price Ranges table because the Price Ranges table is missing a suitable column. Nevertheless, such column can be created by increasing the number of rows in the configuration table.
The table we want to generate contains one row for each value of Sales[Net Price] with the corresponding price range, like in Figure 5.
We renamed the original configuration table to Price Ranges Configuration. The Price Ranges table can be created as a calculated table using the following code:
Price Ranges =
GENERATE (
    'Price Ranges Configuration',
    FILTER (
        ALLNOBLANKROW ( Sales[Net Price] ),
        AND (
            Sales[Net Price] > 'Price Ranges Configuration'[Min Price],
            Sales[Net Price] <= 'Price Ranges Configuration'[Max Price]
        )
    )
)
This new table contains exactly one row for each distinct value of the Sales[Net Price] column. Therefore, it is possible to create a relationship between Sales and the new Price Ranges calculated table based on the Net Price column, as shown in Figure 6.
With this optimization, there is no need to create a new column in Sales, because the model uses the existing Sales[Net Price] column to setup the relationship. Therefore, no calculated column in Sales must be recomputed during data refresh. The original Price Ranges Configuration table should be hidden in the model in order to avoid any possible confusion for the end users.
On smaller models, creating a calculated column is not an issue. Therefore, the basic solution that does not involve new tables is to be preferred. On larger models, this version reduces the processing time.
Returns all the rows in a table, or all the values in a column, ignoring any filters that might have been applied.
ALL ( [<TableNameOrColumnName>] [, <ColumnName> [, <ColumnName> [, … ] ] ] )
When a column name is given, returns a single-column table of unique values. When a table name is given, returns a table with the same columns and all the rows of the table (including duplicates) with the additional blank row caused by an invalid relationship if present.
VALUES ( <TableNameOrColumnName> )
Returns a one column table that contains the distinct (unique) values in a column, for a column argument. Or multiple columns with distinct (unique) combination of values, for a table expression argument.
DISTINCT ( <ColumnNameOrTableExpr> )
Returns all the rows in a table except for those rows that are affected by the specified column filters.
ALLEXCEPT ( <TableName>, <ColumnName> [, <ColumnName> [, … ] ] )
Clear filters from the specified tables or columns.
REMOVEFILTERS ( [<TableNameOrColumnName>] [, <ColumnName> [, <ColumnName> [, … ] ] ] )
This pattern is designed for Power BI / Excel 2016-2019. An alternative version for Excel 2010-2013 is also available.
This pattern is included in the book DAX Patterns, Second Edition.


Video

Do you prefer a video?
This pattern is also available in video format. Take a peek at the preview, then unlock access to the full-length video on SQLBI.com.Watch the full video — 26 min.
Downloads
Download the sample files for Power BI / Excel 2016-2019: